The emotional weight of a loading screen
Three seconds is never just three seconds. What matters is what the person thinks is happening while they wait.
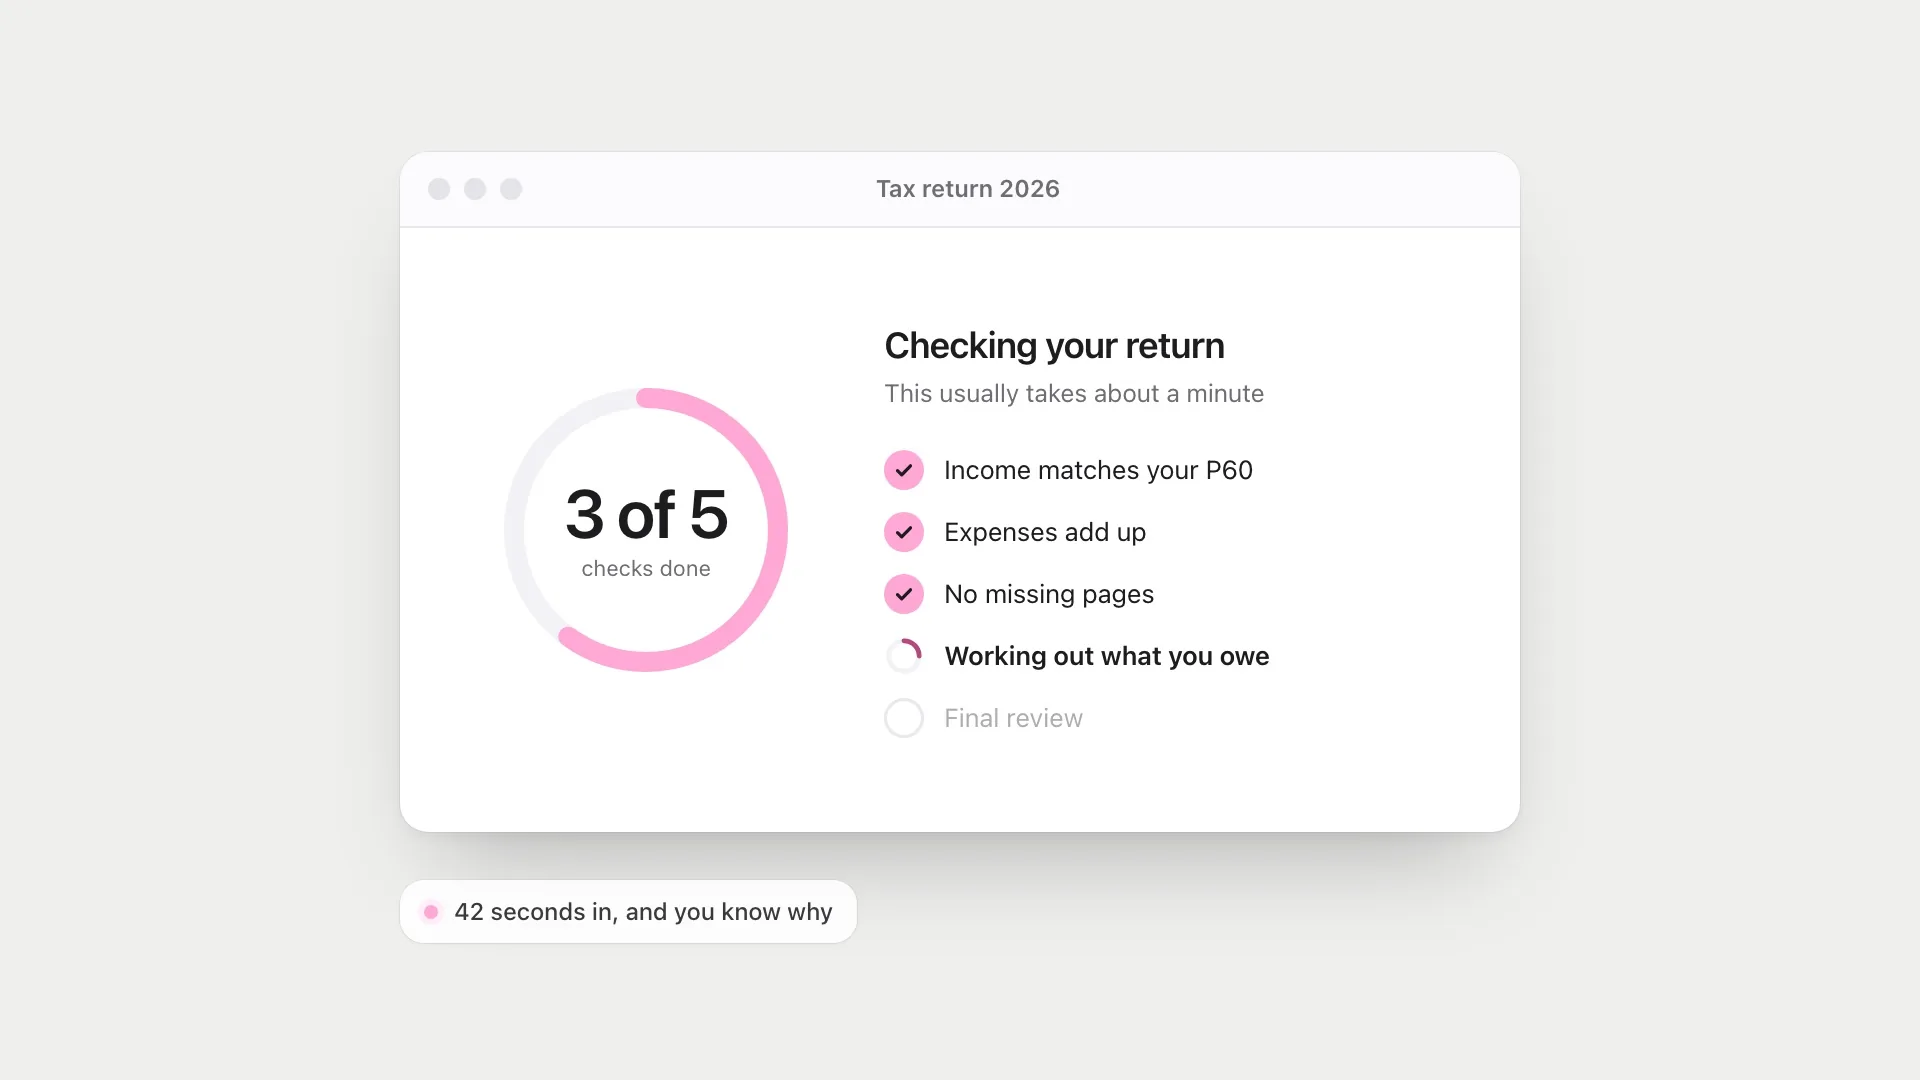
Most advice about loading screens is about making them shorter, and that advice is right. Faster is almost always better. But some waits can’t be removed, and I’ve noticed that two waits of exactly the same length can feel completely different. One feels like the product is working hard for you. The other feels like it’s broken.
The difference isn’t time. It’s what the person believes about the time.
That sounds like a soft, designerly claim, but it’s well supported. Research on waiting, from airline delays to progress bars, keeps arriving at the same place: the clock matters less than what the wait seems to mean. It’s also full of trade-offs. Some things that make a wait feel shorter make it feel worse. Some things that make people trust a result are easy to fake.
Waiting is mostly about uncertainty
In 1985 David Maister wrote a short essay about queues that designers still quote, because it sounds so clearly true. Among his principles: unexplained waits feel longer than explained ones, uncertain waits feel longer than known ones, and anxiety makes any wait feel longer. None of these is about the clock.
Maister wrote from experience, not experiment. When researchers tested his principles, most held up, with some useful complications.
Shirley Taylor studied passengers whose flights had been delayed. Delays did hurt how people rated the airline, but not directly. The damage ran through feelings: uncertainty about what would happen, and anger. Anger was strongest when passengers thought the airline could have prevented the delay. Uncertainty was eased when their time was filled. In other words, the minutes didn’t do the harm. What the minutes seemed to say about the airline did.
Michael Hui and David Tse then tested what to tell people while they wait. They compared telling people how long the wait would be with telling them where they were in the queue. For short waits, neither made a difference. For medium waits, the expected duration helped most. For long waits, queue position helped more than a time estimate. That matches something I recognise: on a long wait, a number of minutes starts to feel like a promise you’re watching get broken, while “you’re next” feels like movement.
There’s a twist in this work that I think designers miss. In a field experiment on telephone queues, Gerrit Antonides and colleagues found that telling callers the expected wait made their estimates of the wait more accurate. People normally overestimate how long they’ve been waiting, and the information reduced that. But it also made each minute they felt they’d waited count more heavily against the service. Information doesn’t simply make waiting nicer. It makes the wait legible, and a legible wait is easier to judge, for better or worse.
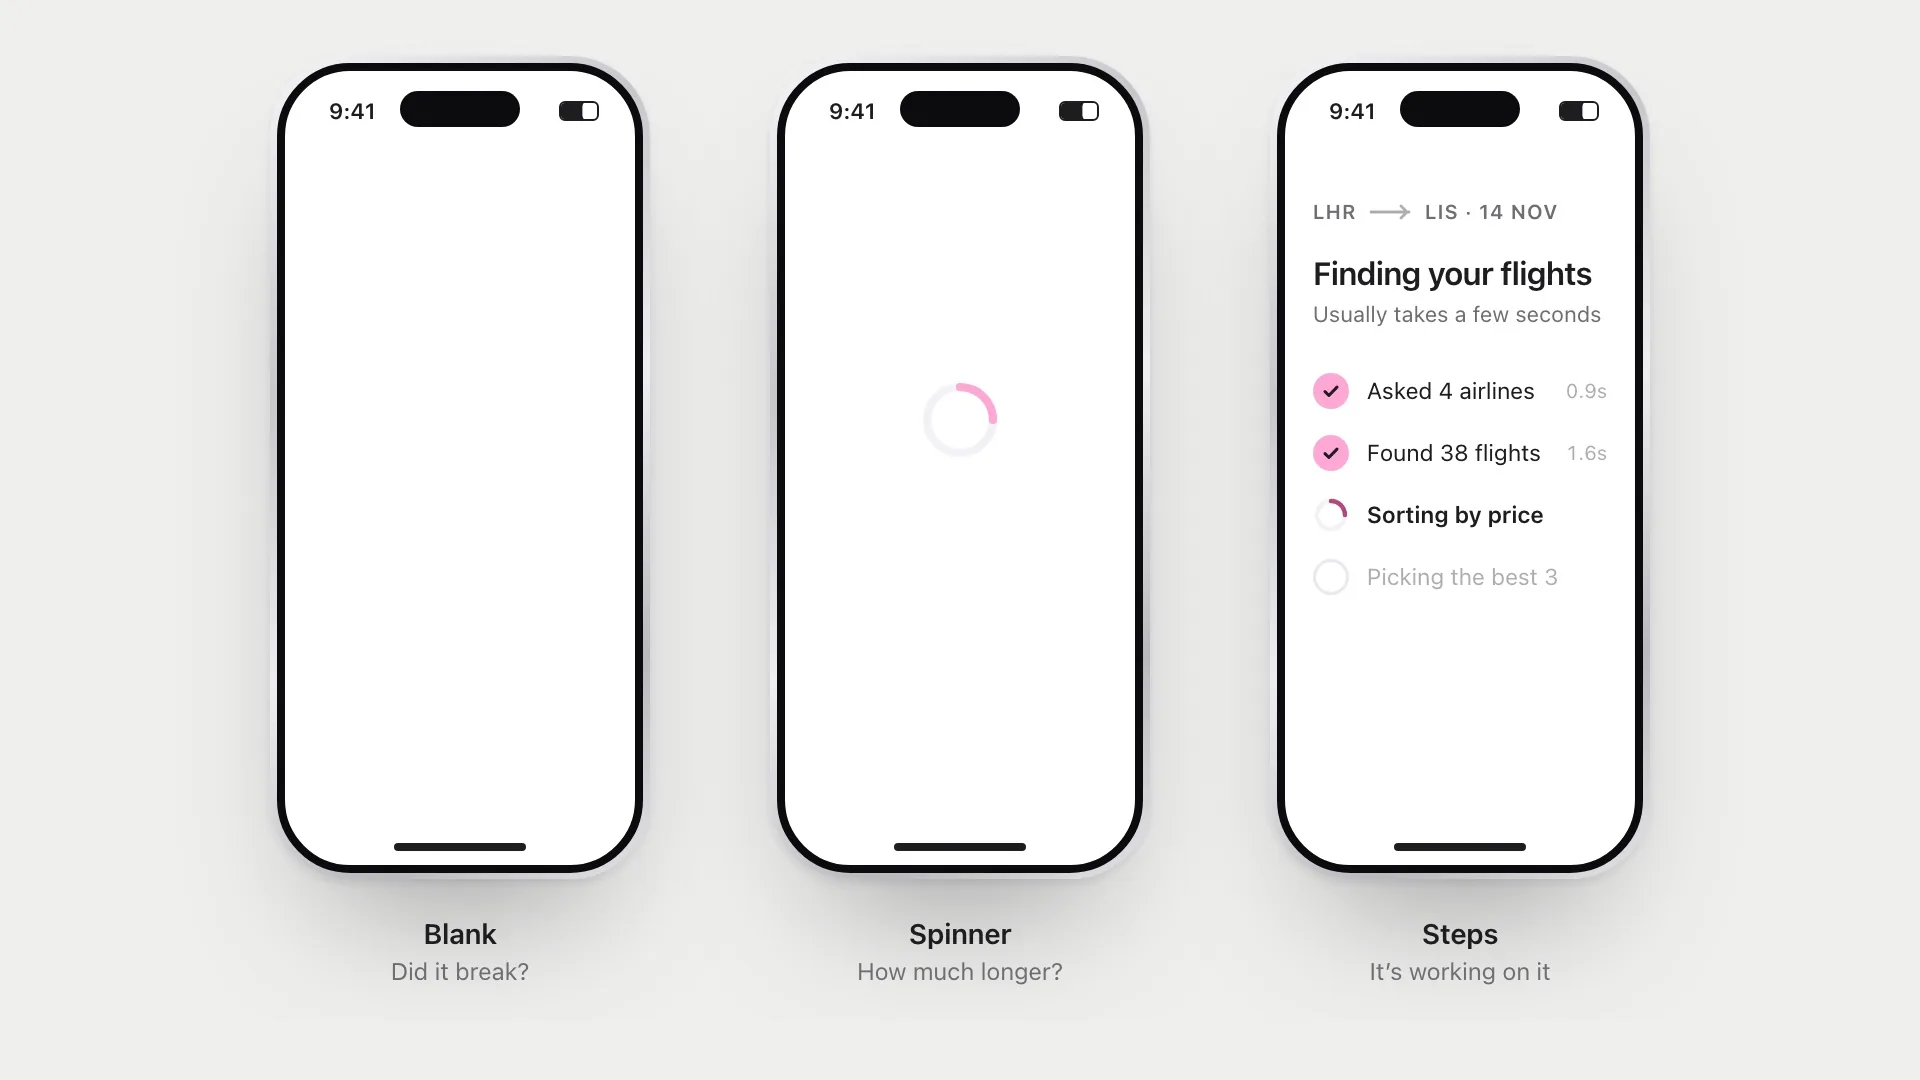
A blank screen is the worst case on every count. You don’t know why you’re waiting, or for how long, and after a second or two you start to wonder if you broke something. Designers often quote rough limits here: a tenth of a second feels instant, a second keeps your train of thought, ten seconds loses your focus. Those numbers trace back to Robert Miller’s 1968 paper on response time, which drew more on reasoning about attention than on controlled experiments. His main point was that there is no single acceptable delay. The question is always “response time to what?” A pause that’s fine after asking for a report is far too long after a key press. Treat the thresholds as rules of thumb. Somewhere past a second, though, the wait needs to explain itself.
Why watching the clock makes it slower
The mechanism comes from research on how we judge time. Psychologists separate judging a duration while you’re in it, knowing you’ll care how long it takes, from judging it afterwards from memory. Waiting for a screen is the first kind. You’re timing it, whether you mean to or not.
A meta-analysis of 117 experiments by Richard Block, Peter Hancock and Dan Zakay found that in this situation, the more mental work people are doing, the shorter the interval feels. The usual explanation is attention: time seems to pass more slowly the more attention you give it, and anything that takes attention away from the passing of time shortens it. But the same review found the opposite pattern when people judge a duration afterwards, from memory. A busy interval can feel short while you’re in it and long when you look back.
This is why a spinner feels slow. It gives you nothing to do except watch time pass. It’s also why the obvious fix, giving people more to look at, has a catch.
Russell Branaghan and Christopher Sanchez tested this directly. People chose a film from a simulated database and then waited, looking at a static message, animated dots, a progress bar moving at a constant rate, or one moving at a variable rate. What people preferred and what they judged reasonable didn’t line up. They preferred displays that told them more. But busier, more attention-grabbing displays made the wait feel less reasonable. The design that did well on both was the plain progress bar moving steadily: informative without demanding attention.
This corrects one of my own instincts. When a wait is unavoidable, the temptation is to make it rich: animations, tips, rotating messages. The goal isn’t to entertain people. It’s to answer their question, “is this working, and how long?”, as calmly as possible.
When slow feels better
Here’s the strange part. Sometimes people prefer the slower version.
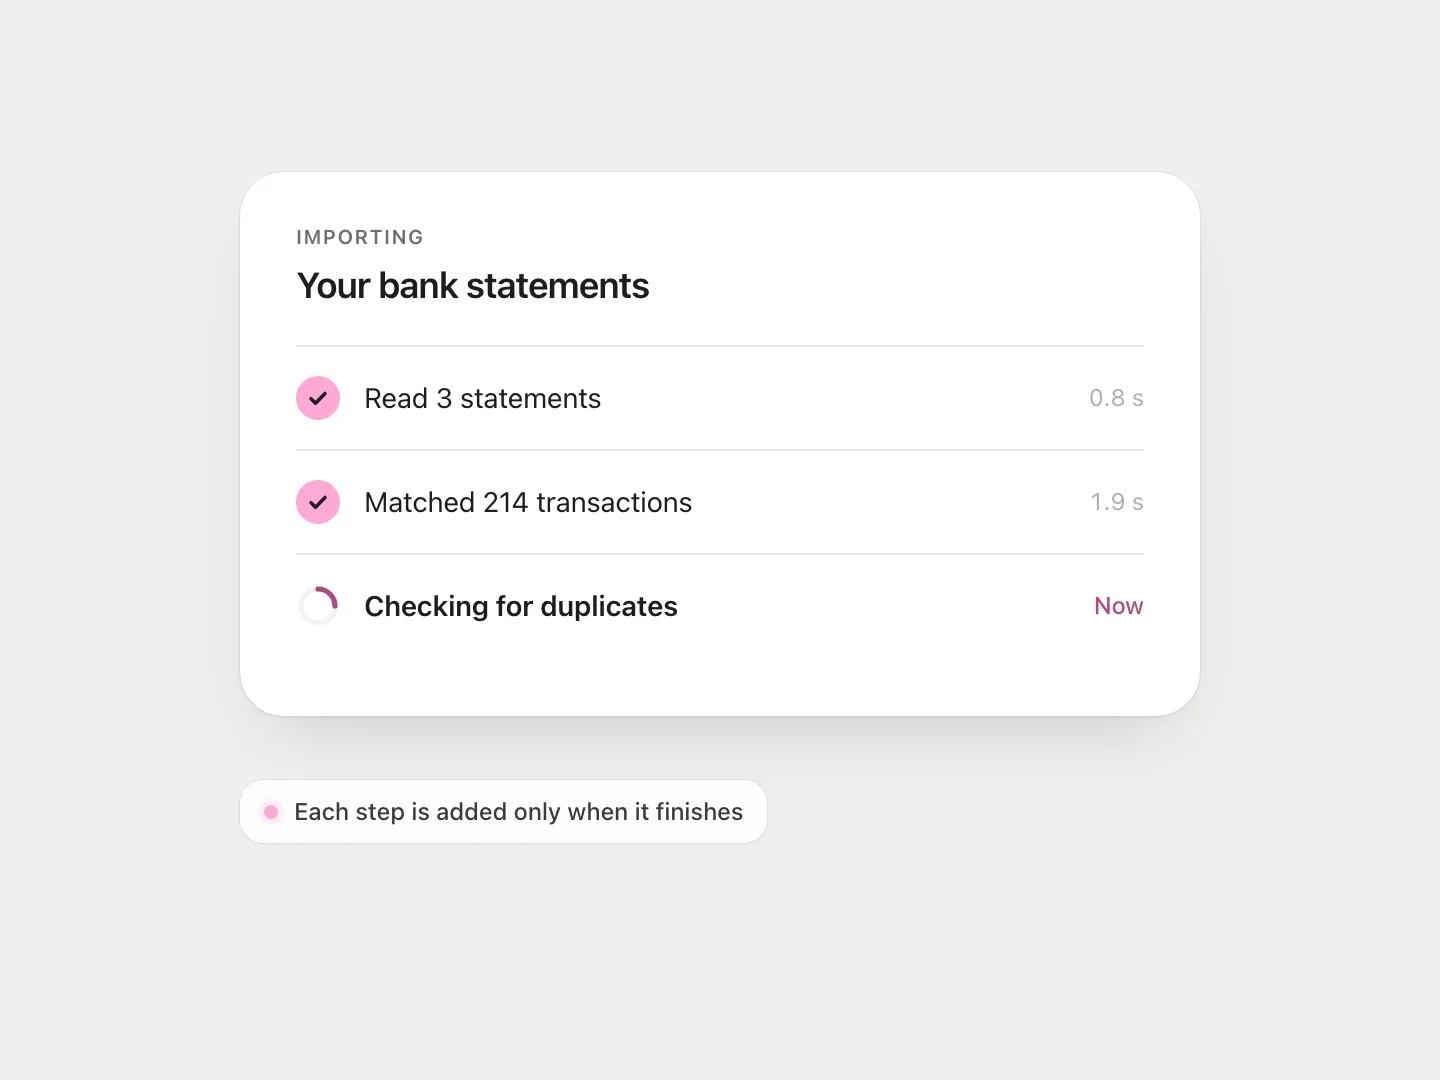
Ryan Buell and Michael Norton called this the labour illusion. In five experiments simulating flight and dating searches, people were more satisfied when the site showed the work it was doing, listing each airline as it was checked, than when the same results appeared instantly. Some even preferred a longer wait with visible effort to an instant result. Seeing the work made the result feel more valuable.
What I find most interesting is their explanation. It isn’t only that people think more effort means a better answer. Buell and Norton found that seeing effort made people feel a kind of reciprocity, a sense that the service had done something for them, and that feeling helped explain why they valued it more. Visible work isn’t just evidence. It’s a gesture.
Two cautions. The studies were simulated online tasks, and the authors themselves explored where the effect stops working, so it’s a reason to design visible work honestly, not proof that slower is better. And the effect depends on who seems to be doing the work, which I’ll come back to.
This still explains why some products add a deliberate pause after you submit a tax return or run a security check. An instant result for something important can feel careless, as if nothing was really checked.
People don’t only judge the result. They judge how much care seemed to go into it.
The line between reassuring and dishonest
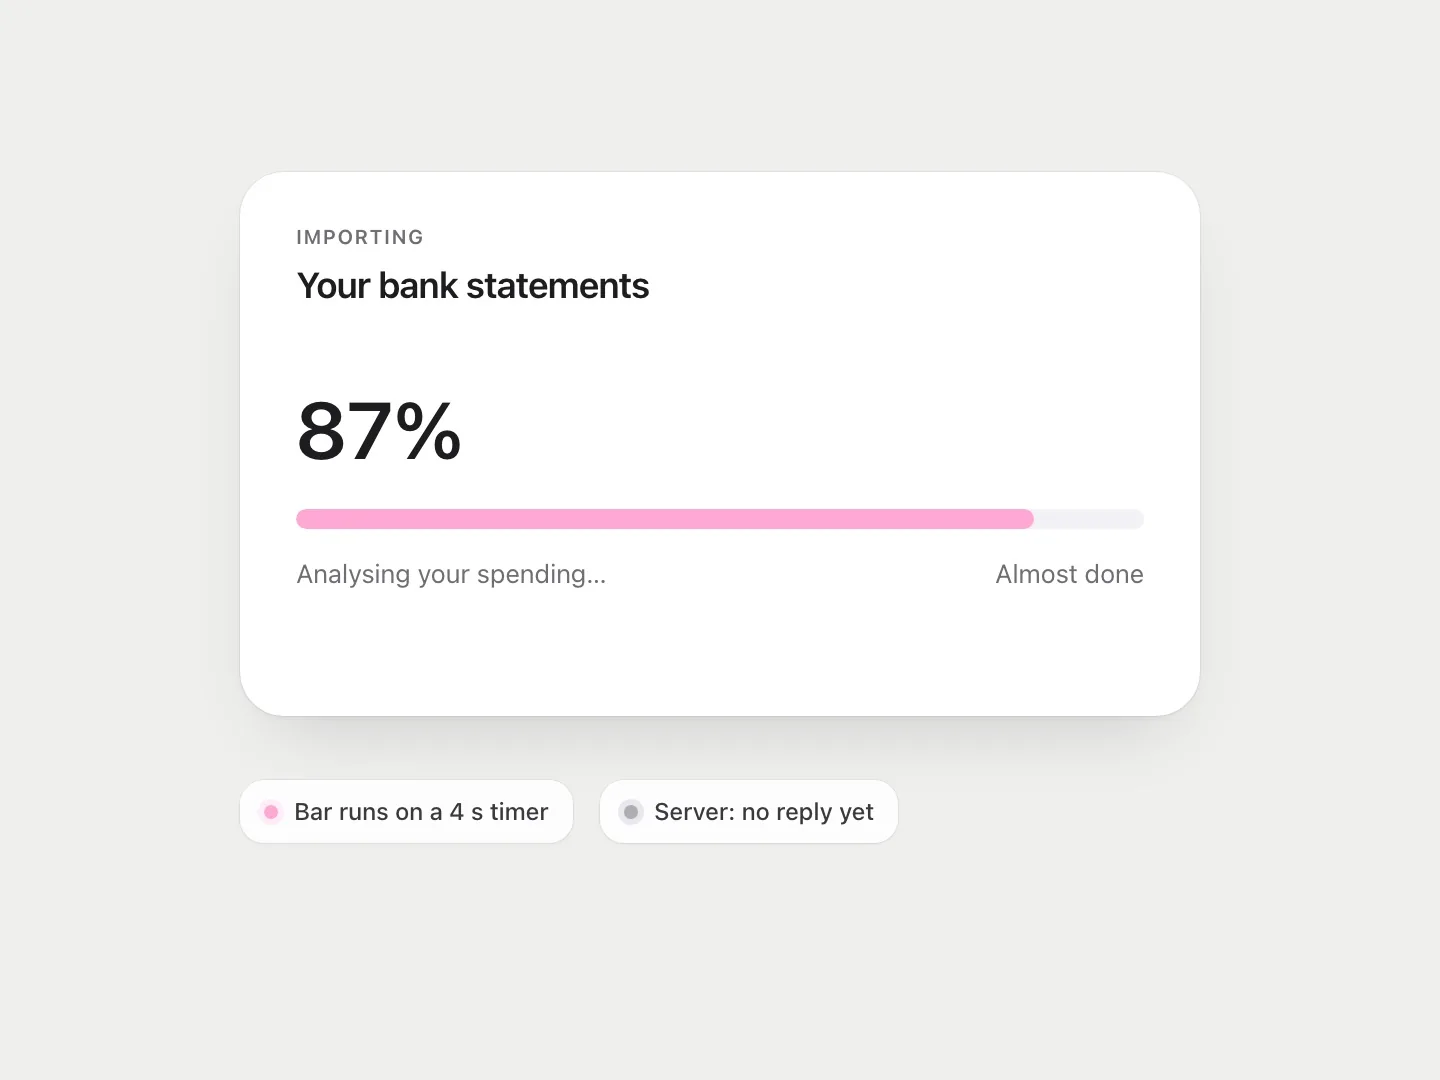
This is where I get uncomfortable. If visible effort makes people trust a result more, it’s tempting to fake effort. Show a progress bar that moves at a pace chosen for feel. Display “Analysing your answers…” while nothing is being analysed. It works, and it’s a small lie.
The research makes the temptation concrete. Chris Harrison and colleagues showed that the same duration feels different depending on how a progress bar moves. In a small comparison study, bars that sped up towards the end were perceived as faster, and bars that paused near the finish as slower, even though every bar took the same time. In a later study, a progress bar with ribbing that moved backwards made the wait feel about 11% shorter, with no change to the actual time.
I don’t think all of this is dishonest. Progress is rarely linear underneath, so mapping real progress onto a bar is a design decision either way. A pattern that makes the same honest progress feel quicker is closer to choosing a nicer typeface. The problem starts when the bar stops being connected to the work at all.
The test I use is simple: would the person feel misled if they saw how it worked? Showing real steps as they happen is fine. Slowing a moment down so a big decision doesn’t feel rushed can be fine, if it’s honest about being a pause. Inventing work that isn’t happening is not, and it trains people to distrust every loading screen they see.
There’s a practical reason too. Taylor’s passengers were angriest when they thought the airline could have prevented the delay. A progress bar stuck at 99% because it never measured anything is a delay someone chose.
AI has made this matter more
Waiting has become a bigger part of products again. AI tools often take several seconds to answer, and some take minutes. The interface choices around that wait shape how people read the answer.
A streaming response, where words appear as they’re generated, keeps you reading and makes the wait feel short. In the terms of the timing research, it fills the wait with something that takes your attention. Showing the steps of a longer task (searching, reading three sources, writing a draft) is the labour illusion applied to software. But both can also make an answer feel more considered than it is. A confident paragraph that took eight seconds to appear isn’t more correct than one that took two.
The research here has a twist I didn’t expect. Emir Efendić, Philippe Van de Calseyde and Anthony Evans ran seven studies on how response time affects trust in predictions. When a person took longer to make a prediction, people judged it more accurate. When an algorithm took longer, people judged it less accurate and were less willing to rely on it. Slowness signalled effort in both cases. But people see prediction as hard for humans and easy for machines, so effort from a machine didn’t read as care. It read as struggle.
I think this is the most important finding for anyone designing AI waiting states, because it cuts against the labour illusion. Visible effort helps when people believe the task is genuinely hard. It can hurt when they expect the machine to find it easy. Showing steps works best when the steps really explain the time: it’s reading forty pages, it’s checking three sources. A vague “Thinking…” does neither job.
This is something I think about with Parallax, an AI that questions your opinions. Its whole job is to help you judge reasoning on its merits, so the waiting state shouldn’t do any persuading of its own. The wait can show that something is happening. It shouldn’t argue for the answer.
What I try to do
- Remove the wait first. Every technique here is a second-best option.
- Say what’s happening once a wait passes about a second, in plain words.
- Keep the display calm. A steady, simple indicator beats a busy one.
- Give a sense of how long, even roughly. “This usually takes about a minute” is better than an endless spinner. For long waits, show movement (“3 of 12 files done”) rather than a countdown that might slip.
- Show real progress, never invented progress. Smoothing honest progress is a design choice. Decoupling the bar from the work is a lie.
- Explain the effort, don’t perform it. Especially for AI, say why it takes time.
- Let people leave. If a task takes long, let them do something else and tell them when it’s done.
A loading screen is one of the few moments when someone is paying full attention to your product and nothing else is happening. What you show in that moment tells them a lot about how much you respect their time.
References
10
- Antonides, G., Verhoef, P. C. & van Aalst, M. (2002). Consumer perception and evaluation of waiting time: A field experiment. Journal of Consumer Psychology, 12(3), 193–202. doi.org/10.1207/S15327663JCP1203_02
- Block, R. A., Hancock, P. A. & Zakay, D. (2010). How cognitive load affects duration judgments: A meta-analytic review. Acta Psychologica, 134(3), 330–343. doi.org/10.1016/j.actpsy.2010.03.006
- Branaghan, R. J. & Sanchez, C. A. (2009). Feedback preferences and impressions of waiting. Human Factors, 51(4), 528–538. doi.org/10.1177/0018720809345684
- Buell, R. W. & Norton, M. I. (2011). The labor illusion: How operational transparency increases perceived value. Management Science, 57(9), 1564–1579. doi.org/10.1287/mnsc.1110.1376
- Efendić, E., Van de Calseyde, P. P. F. M. & Evans, A. M. (2020). Slow response times undermine trust in algorithmic (but not human) predictions. Organizational Behavior and Human Decision Processes, 157, 103–114. doi.org/10.1016/j.obhdp.2020.01.008
- Harrison, C., Amento, B., Kuznetsov, S. & Bell, R. (2007). Rethinking the progress bar. In Proceedings of UIST ’07 (pp. 115–118). ACM. doi.org/10.1145/1294211.1294231
- Harrison, C., Yeo, Z. & Hudson, S. E. (2010). Faster progress bars: Manipulating perceived duration with visual augmentations. In Proceedings of CHI 2010 (pp. 1545–1548). ACM. doi.org/10.1145/1753326.1753556
- Hui, M. K. & Tse, D. K. (1996). What to tell consumers in waits of different lengths: An integrative model of service evaluation. Journal of Marketing, 60(2), 81–90. doi.org/10.1177/002224299606000206
- Miller, R. B. (1968). Response time in man-computer conversational transactions. In Proceedings of the AFIPS Fall Joint Computer Conference (pp. 267–277). ACM. doi.org/10.1145/1476589.1476628
- Taylor, S. (1994). Waiting for service: The relationship between delays and evaluations of service. Journal of Marketing, 58(2), 56–69. doi.org/10.1177/002224299405800205