FormaCities ask residents about a street, then go quiet.
Forma is a web app for public input on street changes. Residents see the proposal on the corner they know, pin comments to the exact spot, and come back to see what happened to what they said.
Literature review, 7 semi-structured interviews, affinity mapping, within-subjects test (n = 8), a second round of 5 after fixes
Platform
Web, desktop first · 25 screens, 4 prototype flows
01
Overview
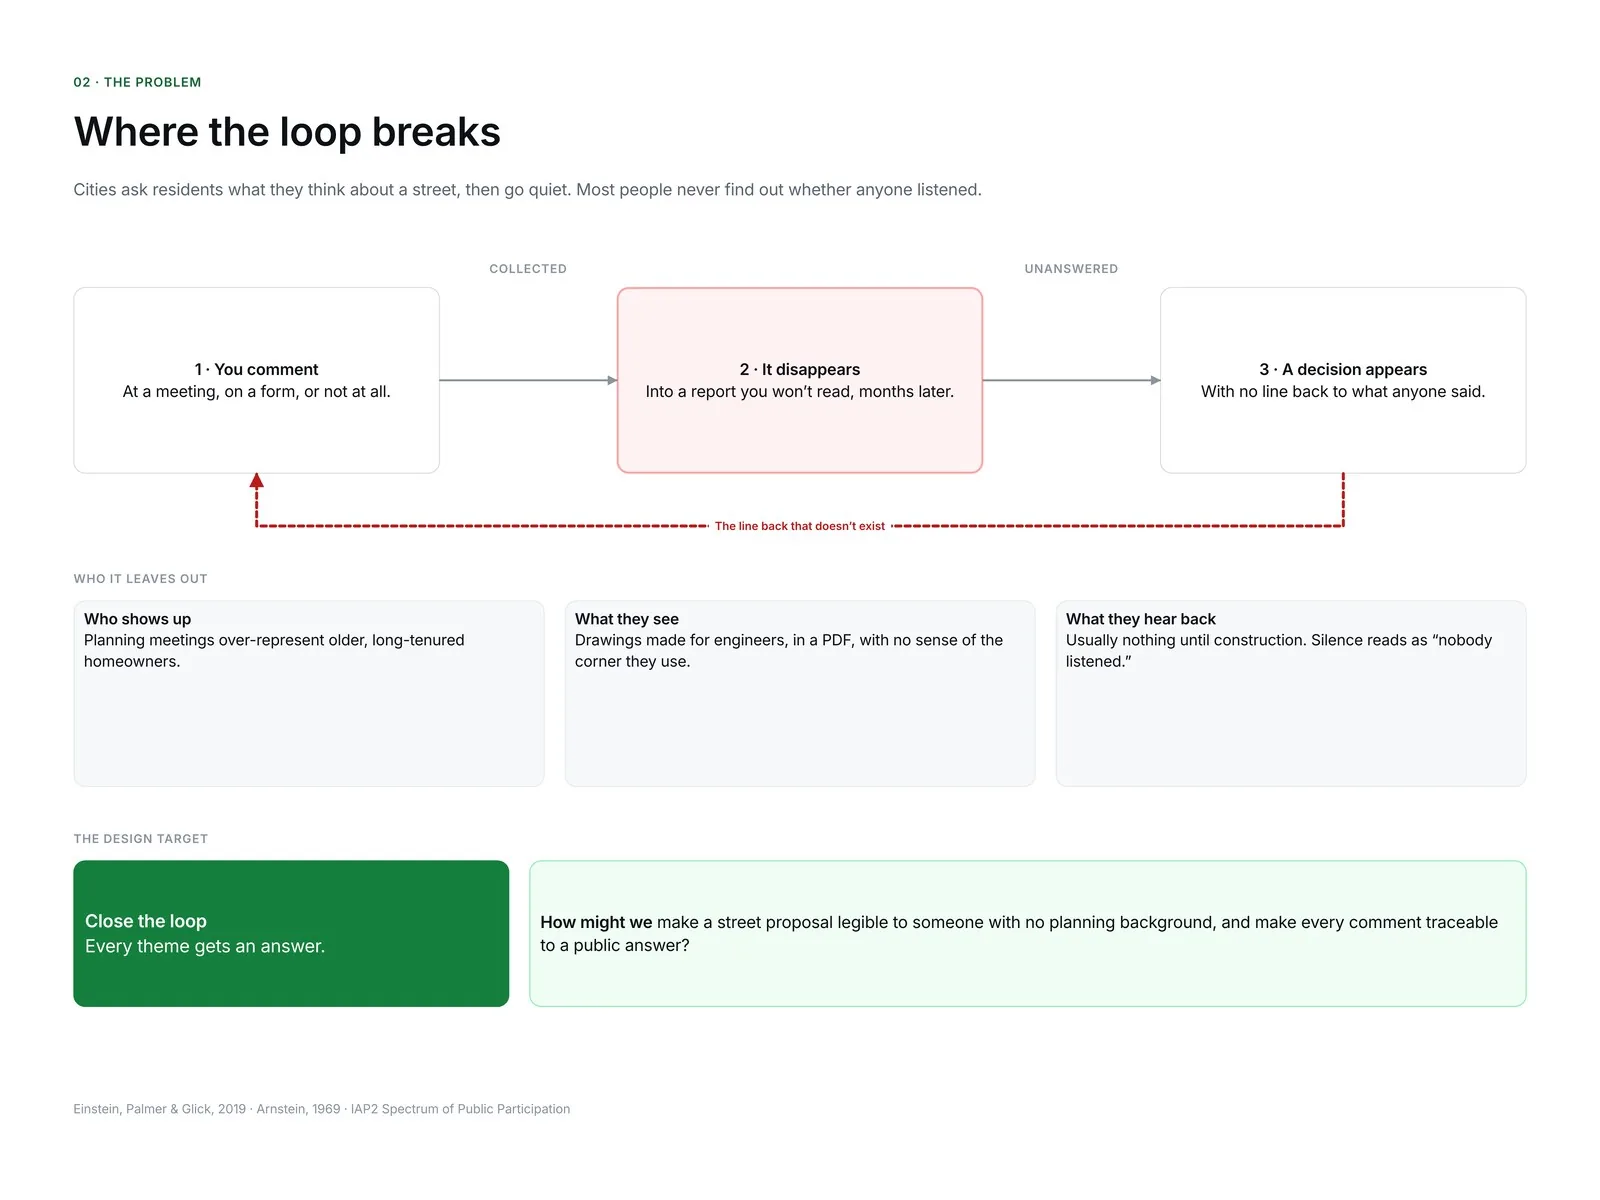
Cities ask residents what they think about a street, then go quiet.
Forma is a participation tool for changes to streets and public spaces. A resident opens a link, drags a handle to see the place today and as proposed, and pins a comment on the corner they mean. Later, the same link shows the theme their comment joined, the team's answer, and what changed in the design and what didn't.
Behind it is a staff workspace where planners group comments, answer each theme and publish a revision, so residents and staff read the same record.
I built it as a working prototype around a real project: SE Hawthorne Pave & Paint, PBOT's 2020 redesign of 28 blocks of one of Portland's High Crash Corridors, with four alternatives on the table. The street, alternatives, survey counts and decision come from PBOT's reports. The resident comments in the product are samples, and it says so on every screen.
In a within-subjects test with 8 residents, 6 could find out what happened to their concern in Forma. None could with the city's survey and PDF.
02
The problem
7,522
Pedestrians killed on US roads in 2022, the highest number since 1981. Many of the fixes are changes to streets and crossings that residents are asked to comment on.
NHTSA, Traffic Safety Facts, 2024
3 of 8
Rungs of Arnstein's ladder of citizen participation that she called tokenism: informing, consultation and placation. People are heard, with no assurance it changes anything.
Arnstein, 1969
Not a cross-section
People who speak at local planning and zoning meetings are more likely to be older, male, long-time homeowners than the communities they speak for.
Einstein, Palmer & Glick, 2019
Different settings and decades: read them as the stakes and the gap, not one dataset.
The people who use a corner every day know things no traffic study does. Yet the usual way to ask them is a weeknight meeting or an online survey with a PDF attached.
People are asked to judge what they can't picture
Proposals arrive as engineering drawings, and surveys turn the confusion into a score from one to five.
The loop never closes
Comments go into a report and a decision comes out months later, with nothing connecting the two. That silence teaches people not to bother next time.
How might I make a street proposal legible to someone with no planning background, and make every comment traceable to a public answer?
03
Research
Why do people stop taking part in street decisions, and what would help them understand a proposal and trust what happens to their comment?
Study plan
Hypothesis
Seeing a change on your own corner, and tracing your comment to an answer, beats a survey and PDF on understanding and trust.
Objective
Learn why people do or don't comment, how they read a proposal, and what planners do with comments.
Generative method
Semi-structured interviews, 60 minutes each. The second half walked through PBOT's PDF and an early Forma concept.
Evaluative method
Within-subjects test against the city's survey and PDF, n = 8, counterbalanced. Then a second round of 5 after fixes.
Participants
6 residents, ages 26 to 71, who walk, cycle and drive, including one at 200% zoom and one reading English as a second language. 1 transportation planner as a stakeholder.
Non-objectives
Which alternative people prefer. How to raise comment volume.
Before the interviews I reviewed what planning research already says about participation. Four sources shaped what I asked.
Planning theory · 1969
A ladder, not a checkbox
What it says
Arnstein puts consultation under tokenism, because nothing guarantees it changes the outcome.
What I took
Collecting comments is the easy part. Showing what each one changed is the product.
IAP2 spectrum
Every level makes a promise
What it says
At “consult”, the promise includes feedback on how input influenced the decision.
What I took
Every theme gets a disposition, and the decision report is a table of them.
Political science · 2019
The room isn't the city
What it says
Meeting speakers are older, more often male and homeowners than their neighbours.
What I took
Recruit beyond the usual voices, and never label counts as public opinion.
“You said, we did”
The format worth keeping
What it says
Some public bodies pair what residents said with what changed. People read it.
What I took
The revision card, plus the column most versions leave out: what didn't change.
From notes to themes
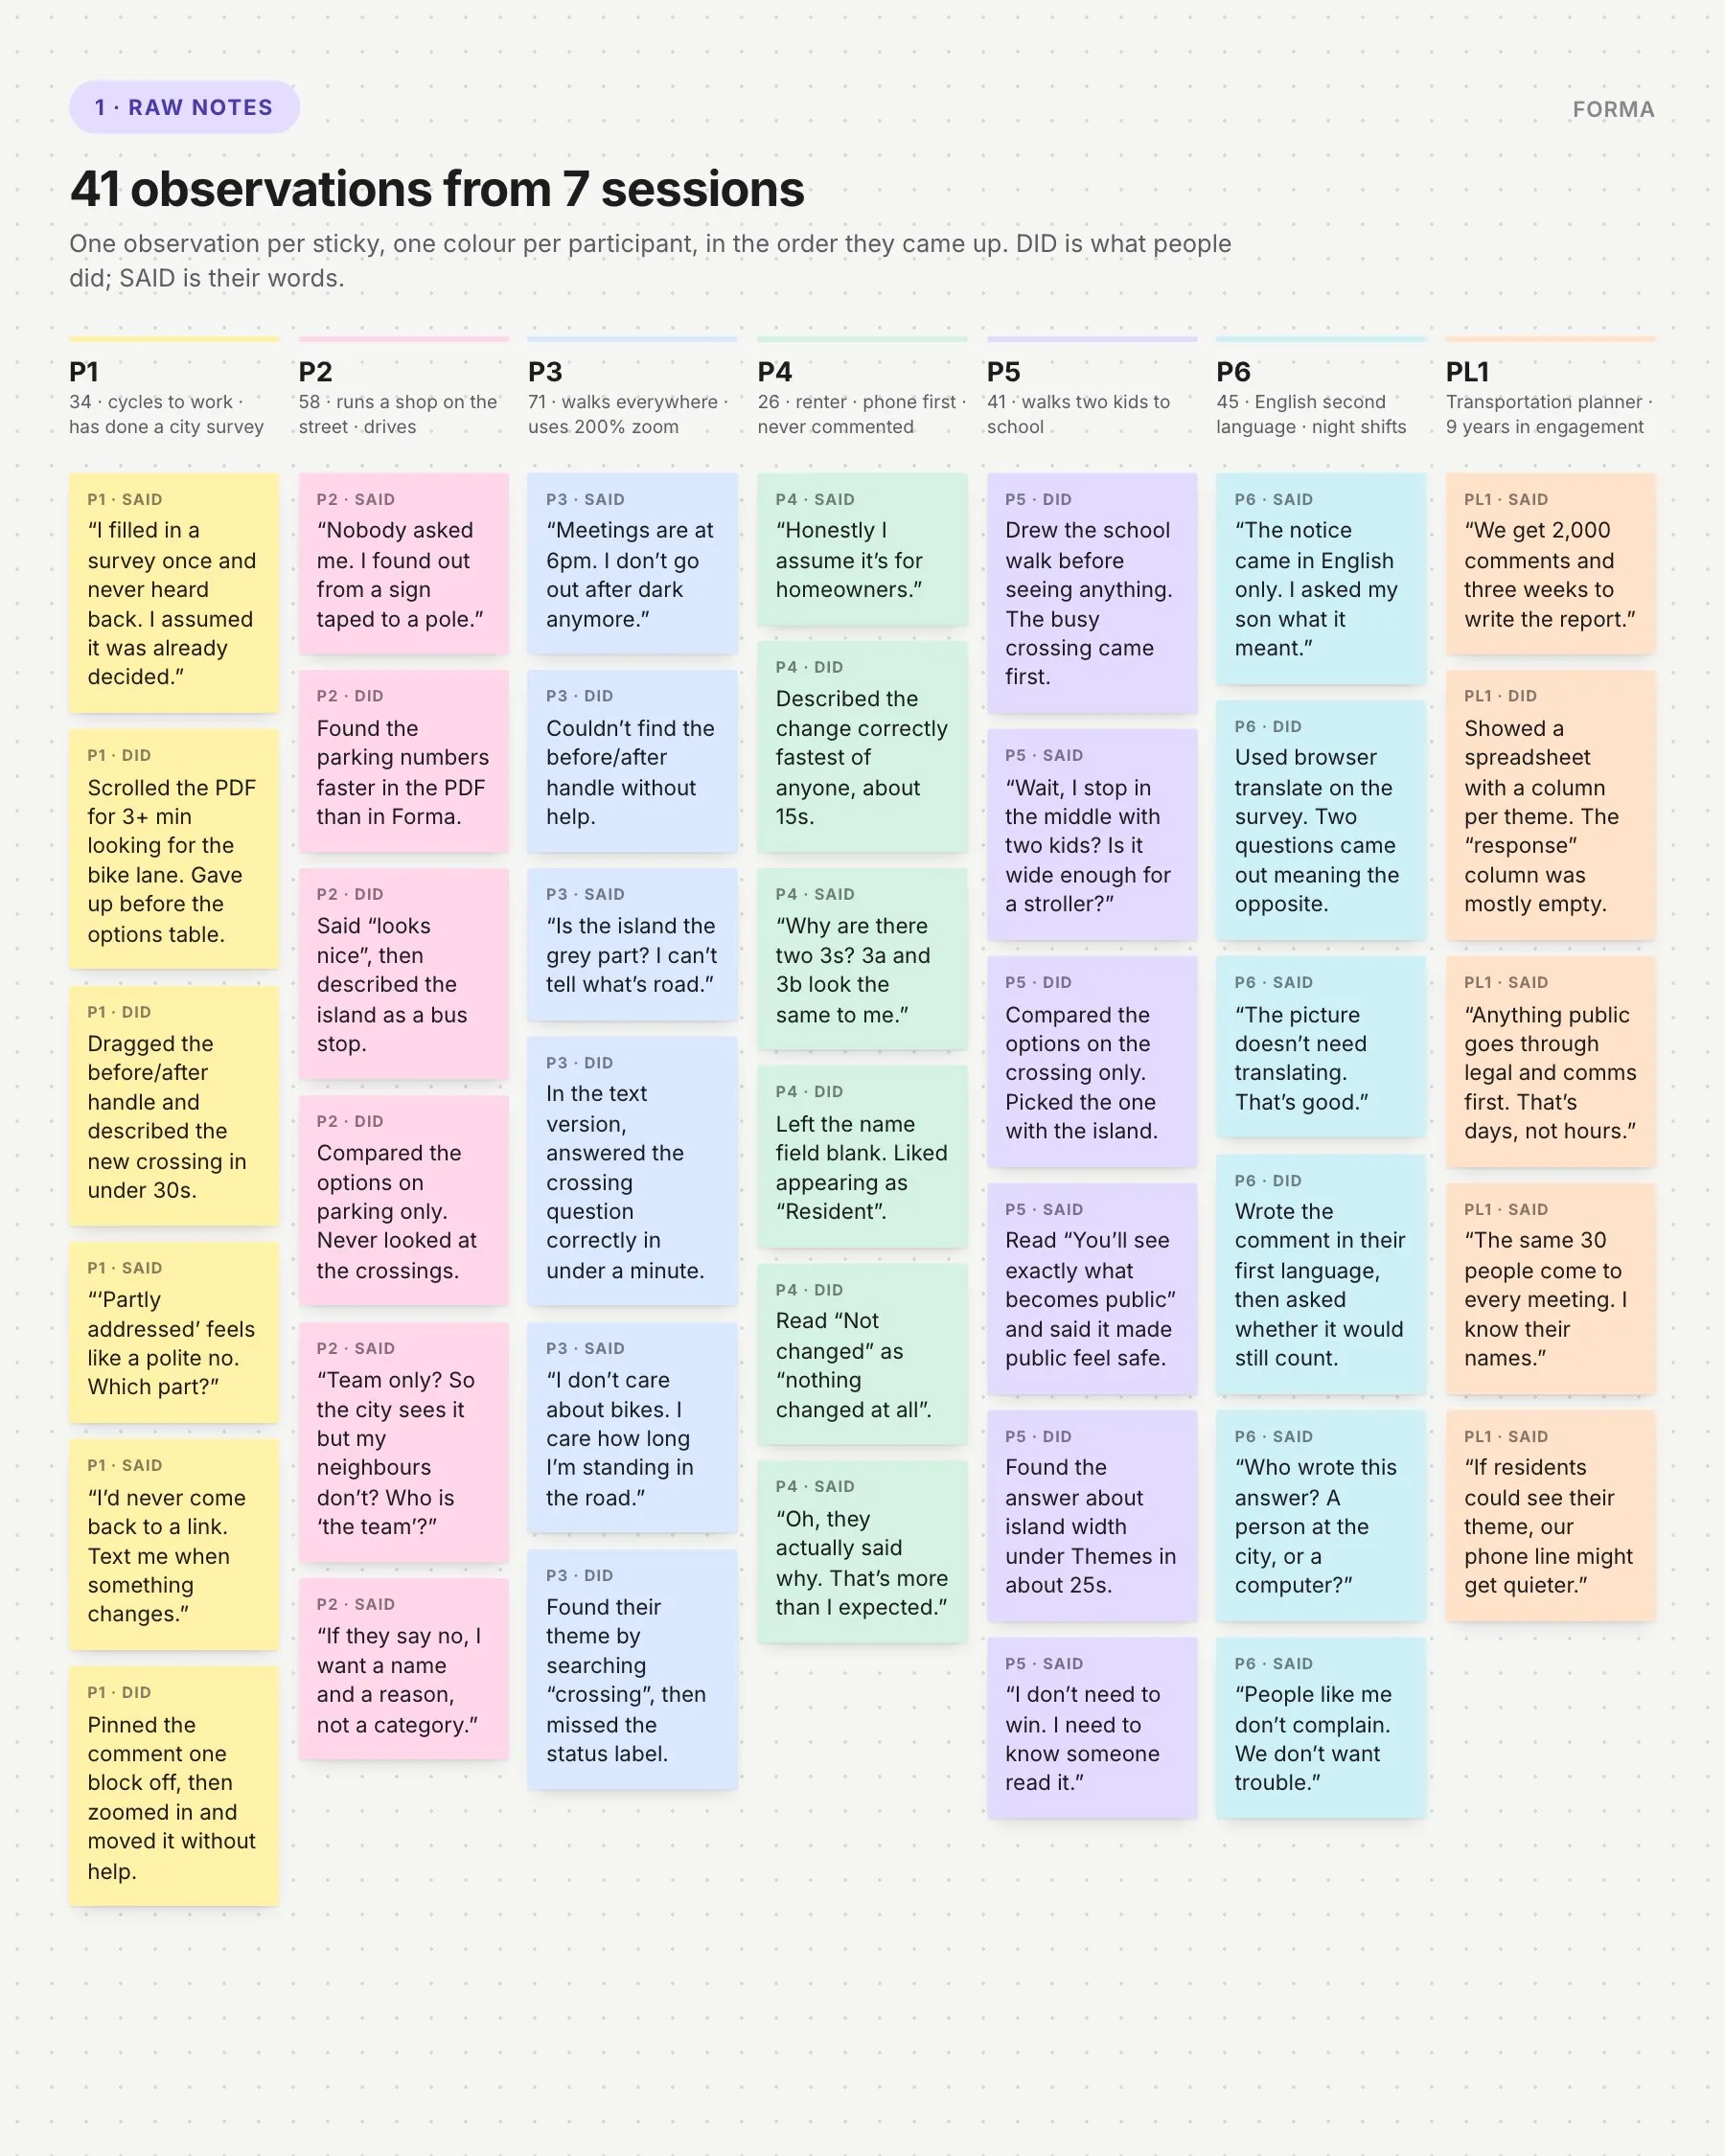
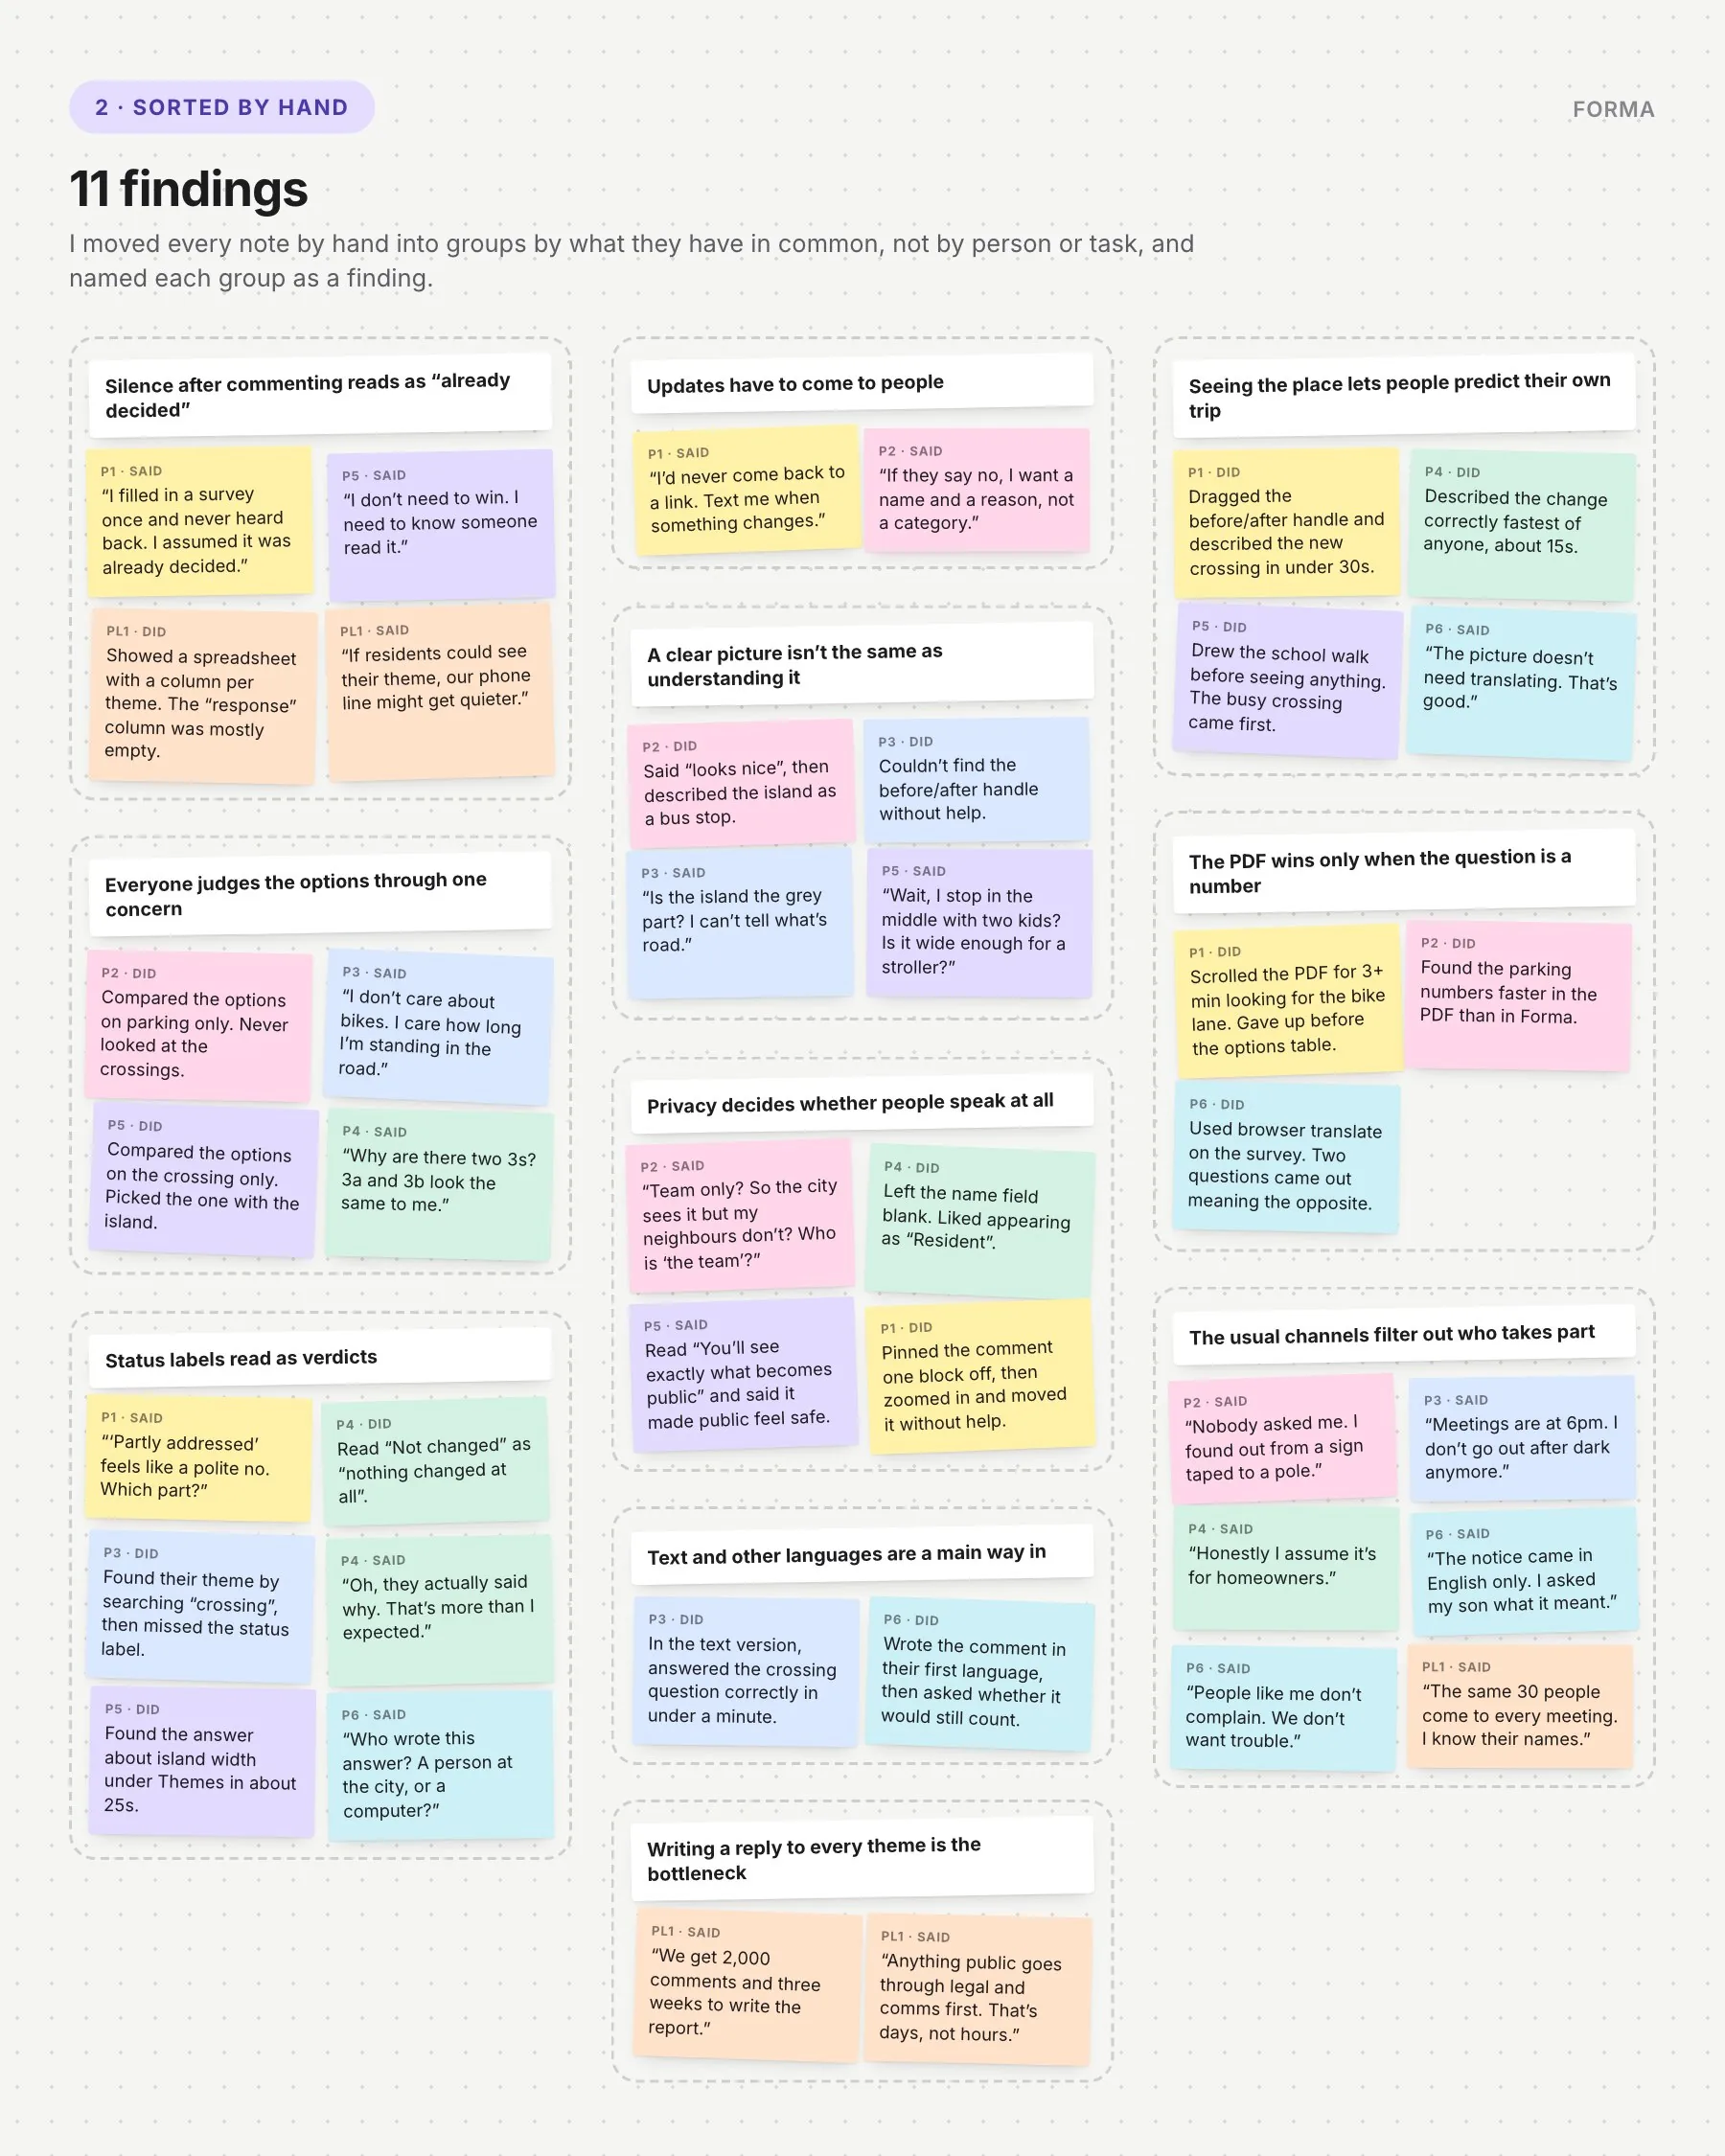
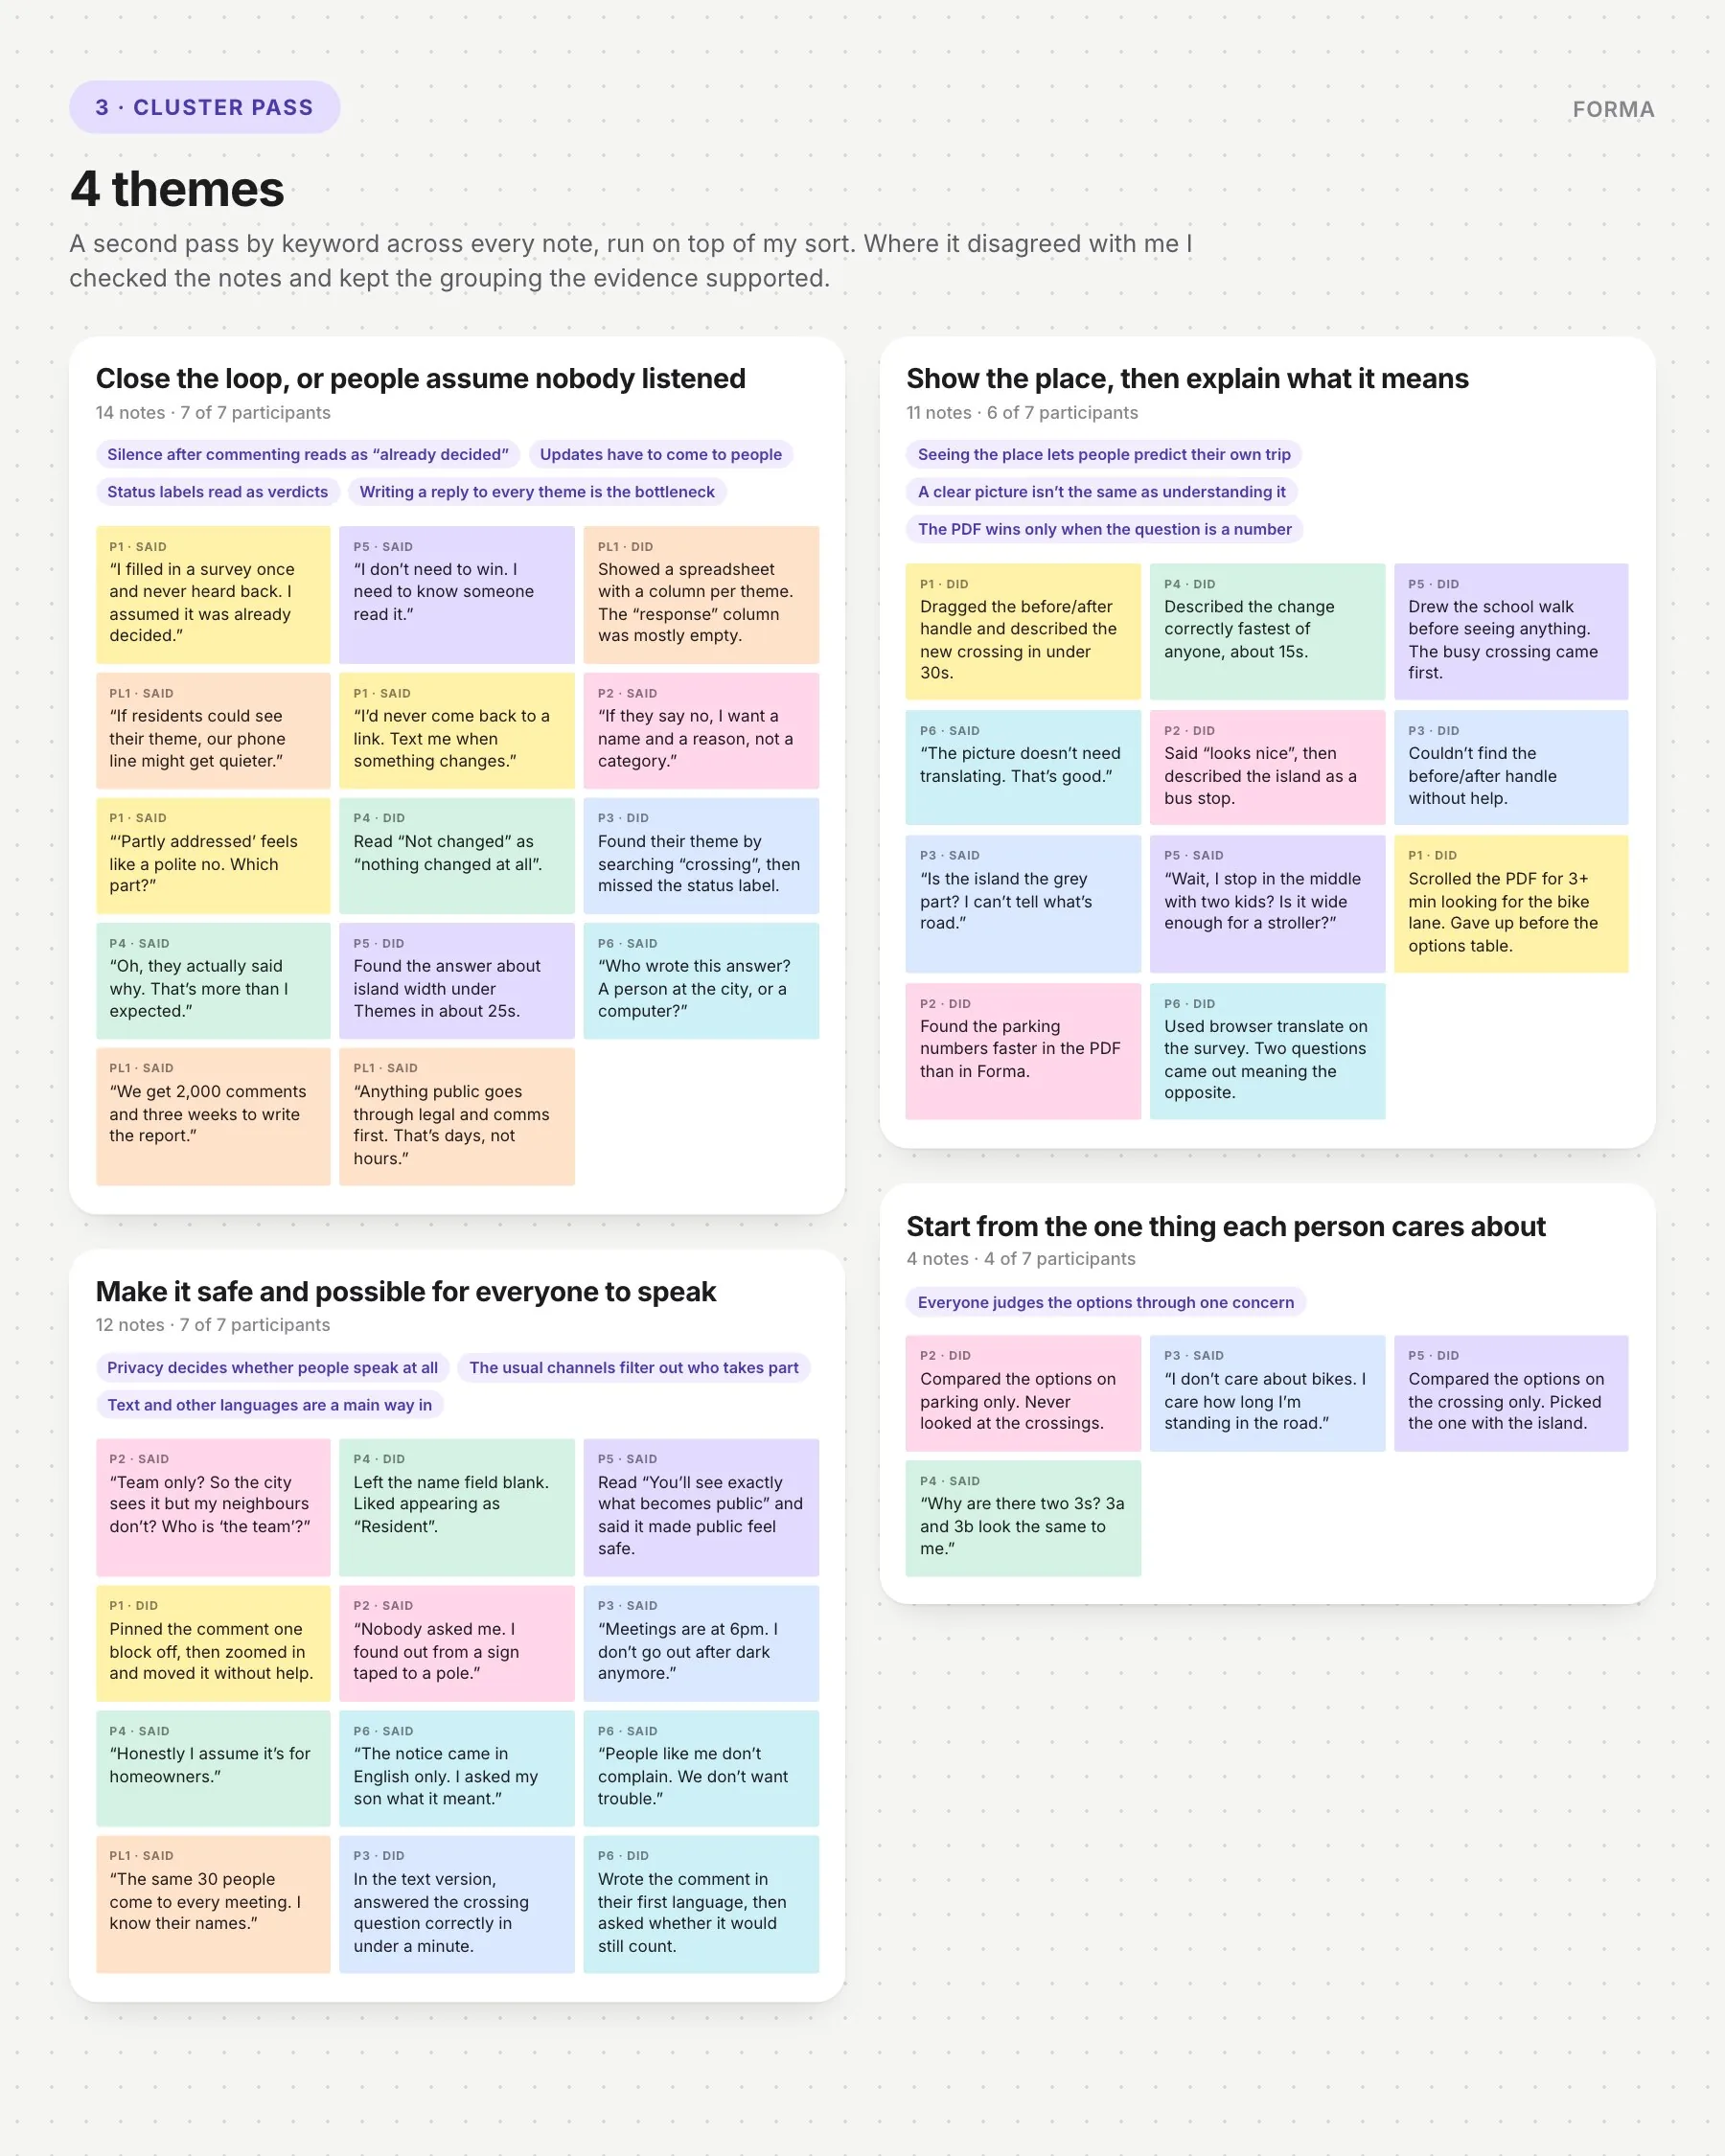
I wrote one observation per sticky, one colour per person, sorted all 41 by hand into findings, then ran a cluster pass over the sort to group them into themes.
1. Raw notes. 41 observations from 7 sessions.
2. Sorted by hand. 11 findings, named as sentences.
3. Cluster pass. A keyword pass on top of the sort: 4 themes.
What I found
Need
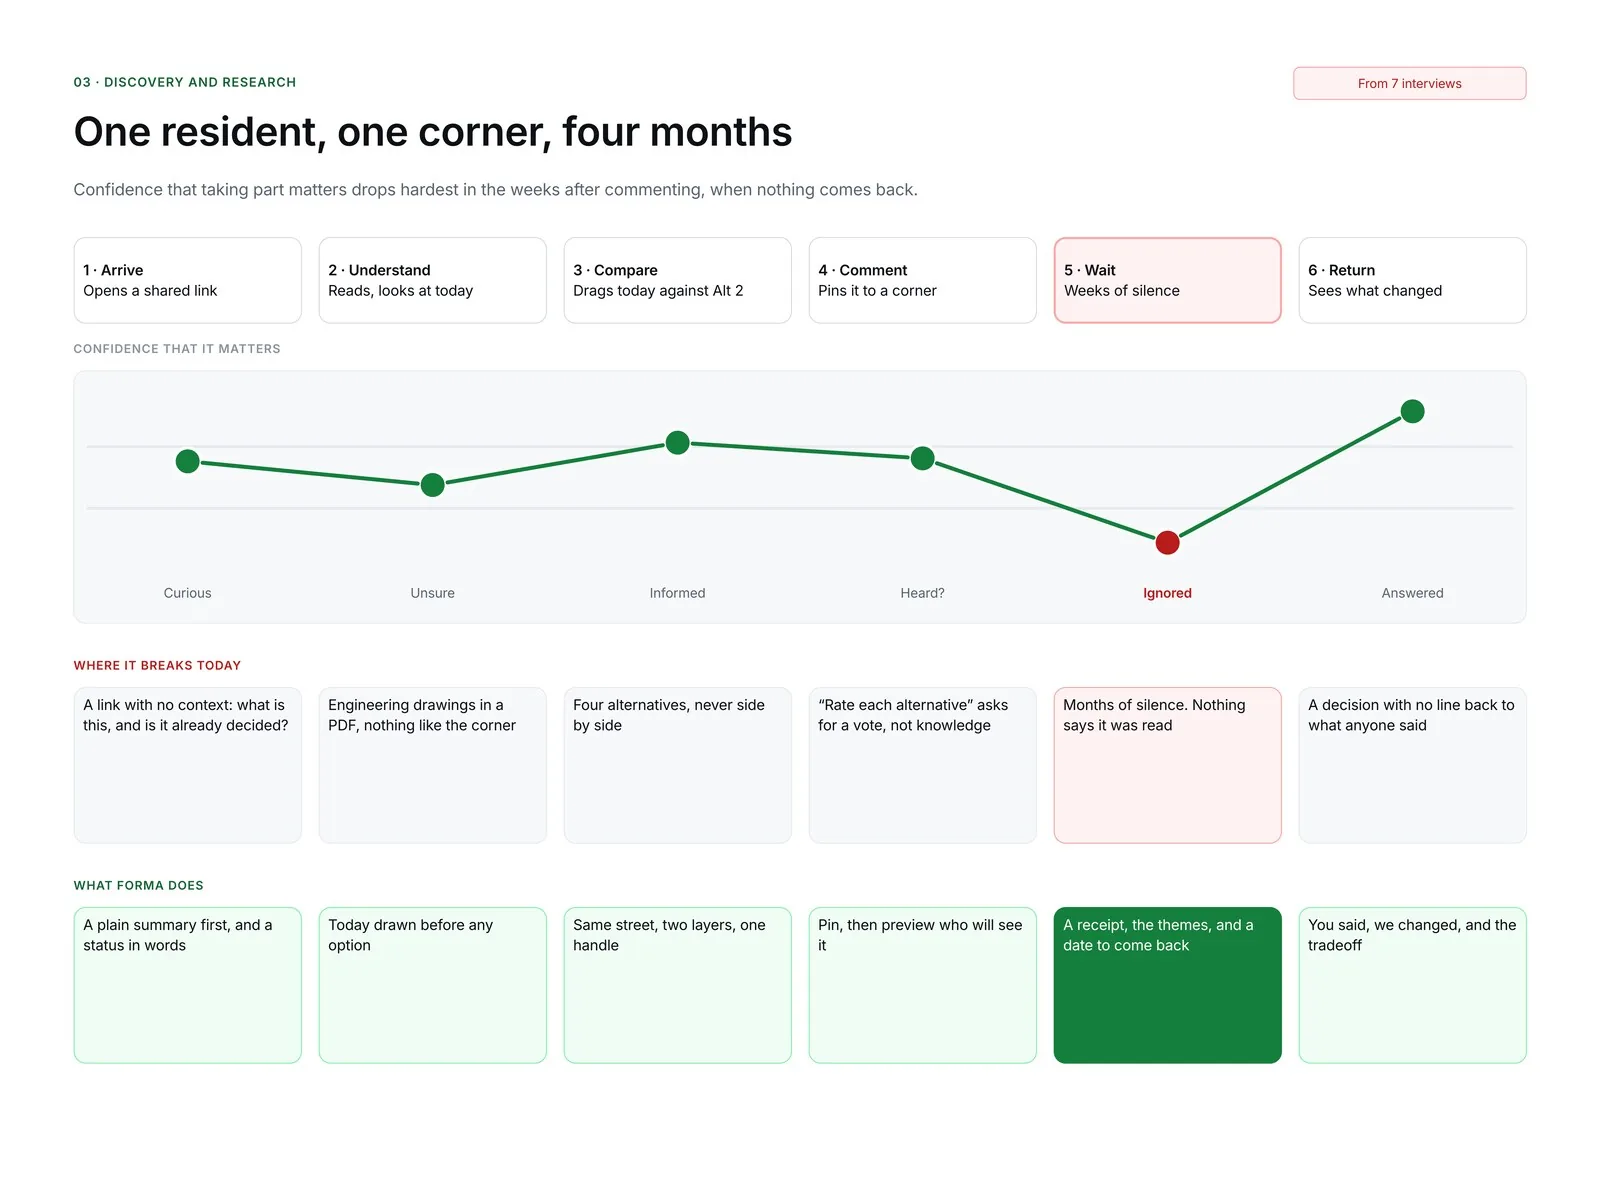
Silence after commenting reads as “already decided”
Evidence
“I filled in a survey once and never heard back. I assumed it was already decided.” Closing the loop came up with all 7 participants, in 14 notes.
So
Every theme needs a public answer and a status people can find from their own comment.
Behaviour
Everyone judges the options through one concern
Evidence
“I don't care about bikes. I care how long I'm standing in the road.” 4 of 7 compared the alternatives on a single thing, like parking or the crossing.
So
Start from a place and a topic, not a full options table.
Motivation
Privacy and access decide whether people speak at all
Evidence
“People like me don't complain. We don't want trouble.” All 7 raised who sees a comment, when meetings happen, or which language a notice comes in.
So
No account, “Resident” by default, a preview of what goes public, and a text version.
Against the concept
A clear picture isn't the same as understanding it
Evidence
One shop owner said “looks nice”, then described the refuge island as a bus stop. “Is the island the grey part? I can't tell what's road.” 3 of 7 misread the drawing.
So
The slider alone isn't enough. Every change needs a label in words on the map.
Recommendations
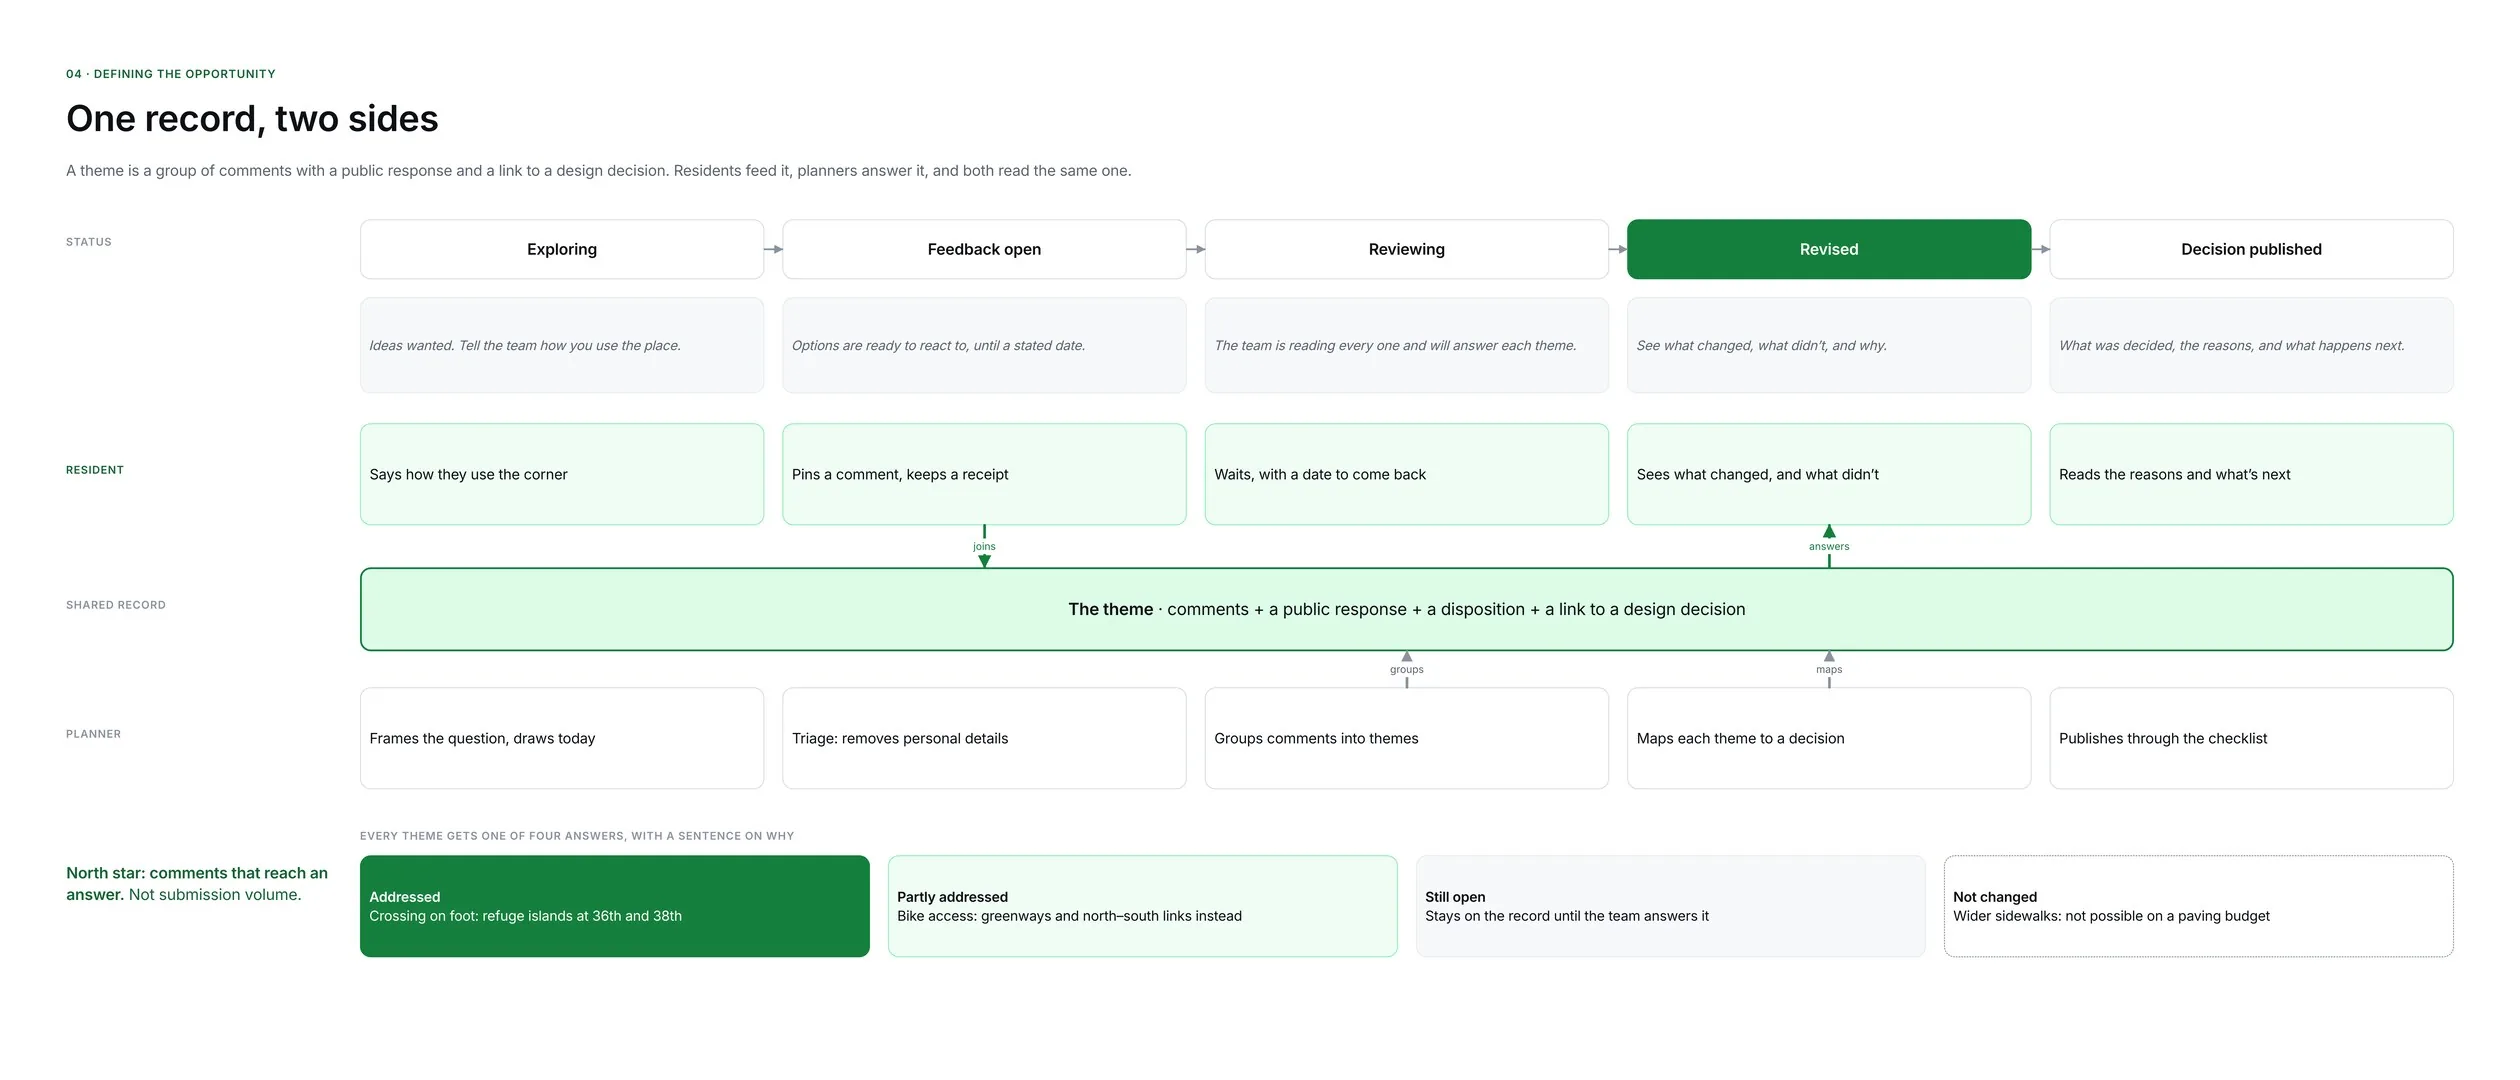
Silence reads as a no → a receipt link with no account, and every theme marked Addressed, Partly addressed, Still open or Not changed.
One concern per person → comments start from a spot on the map, and the comparison filters by topic.
Pictures get misread → named features on the drawing, and a text version that matches it.
Fear of exposure → a preview of exactly what becomes public, and a team-only option.
Replies are the bottleneck → the planner described 2,000 comments and three weeks to report. After the readout I moved the staff workspace from “later” into scope.
Confidence drops hardest in the weeks after commenting, when nothing comes back.
04
Defining the opportunity
A resident only sees an answer if a planner writes one, so I designed for both around one shared object: a theme, a group of comments with a public response linked to a design decision.
Resident: “Show me what this means for my corner, let me say what happens to me there, and tell me what came of it.”
Planner: “Help me keep small but serious concerns visible, and publish an answer I can stand behind.”
Show the place before asking for an opinion. Close the loop after.
One record, two sides: residents feed a theme, planners answer it.
Decisions that shaped the product
Input
Experiences, not ratings
Considered
A star rating for each option.
Why not
It measures preference for something people may not understand. “What works or worries you here?” gets what only a resident knows.
Counting
No likes, no leaderboard
Considered
Upvotes on comments.
Why not
Votes reward organising, not insight. Themes show counts with a warning that this isn't a poll.
Options
Equal weight for every alternative
Considered
Leading with the option the team favours.
Why not
That makes it theatre. All four alternatives get the same card in PBOT's own numbering, including keeping the street as it is.
05
Information architecture and flows
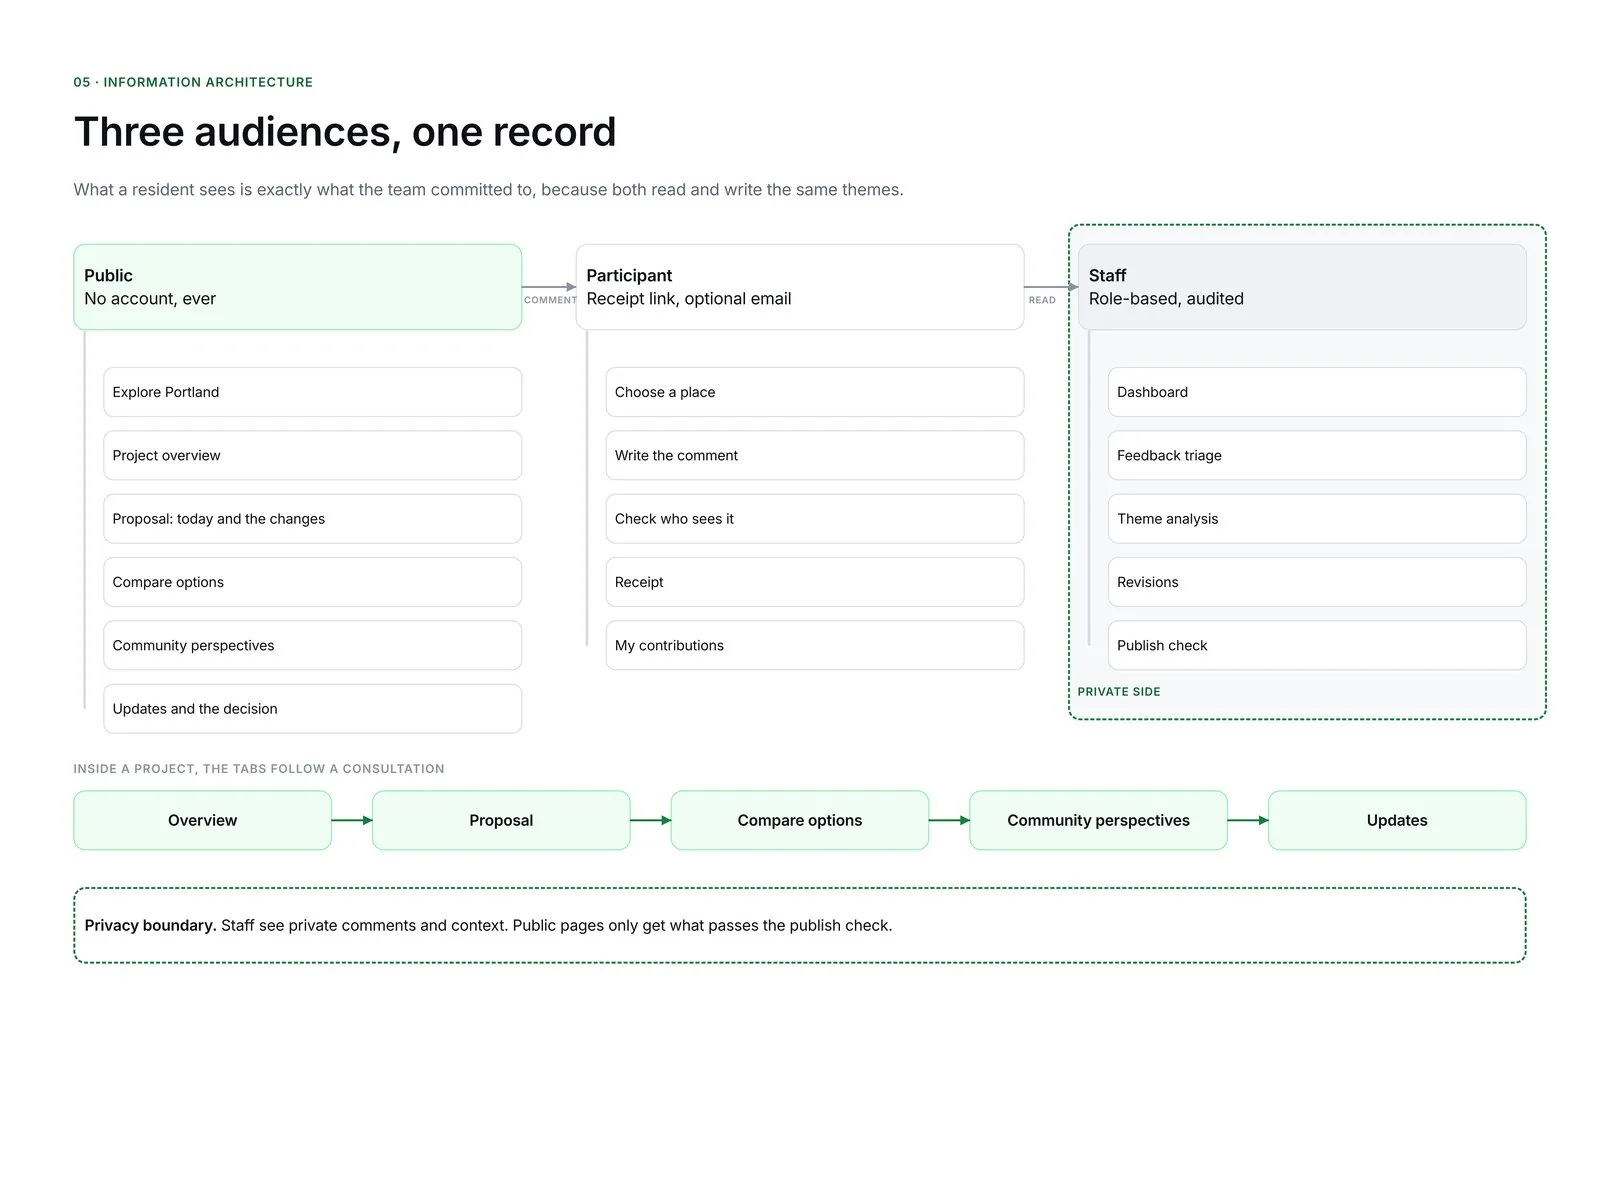
Three audiences, one record.
Public: the overview, today and the options, the comparison, community perspectives, updates and the decision.
Participant: the composer, the privacy preview, a receipt, and a private page to edit or withdraw a comment.
Staff: dashboard, triage, theme analysis, revision mapping and a publish check.
Project tabs follow the order of a consultation, and a status chip says in plain words what kind of input helps right now.
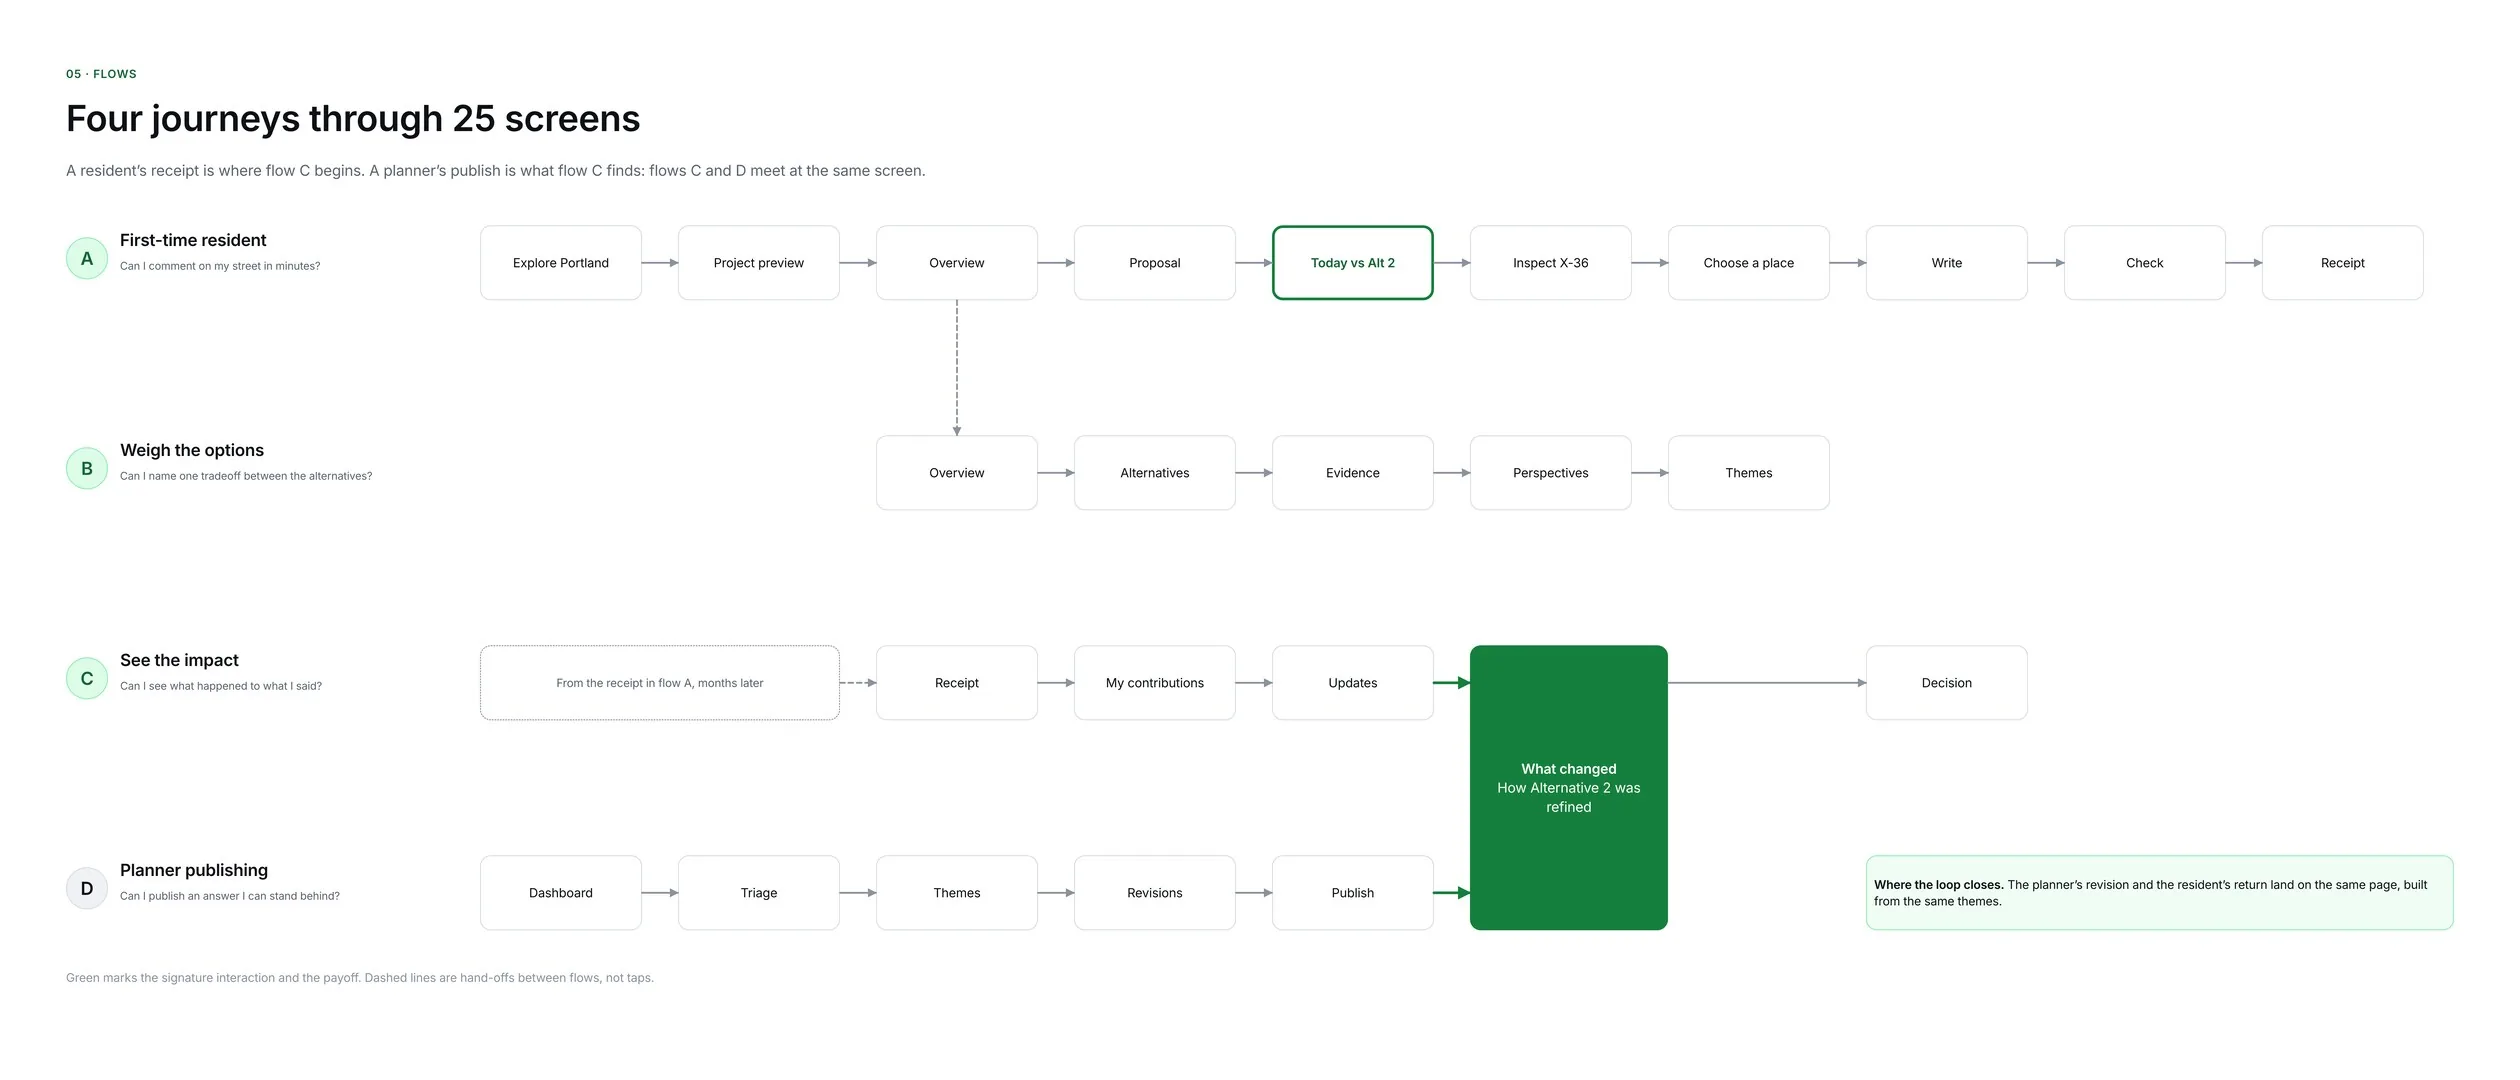
Four connected journeys. Flows C and D meet at the same screen: what changed.
Who sees what
Interviews made privacy the deciding factor, and a neighbourhood tool has a small-group problem: if three people near one corner use a wheelchair, “anonymous” stops meaning much. I wrote the privacy model before any screen.
Information
Public
Project team
Comment text, if you choose public
Yes, with personal details removed
Yes
Comment text, if you choose team only
Never
Yes
Where it's pinned
Rounded to the nearest corner
Exact pin
How you use the corner
Only in totals of ten or more
Yes
Email, if given
Never
Only to send updates
Your name
Optional; shown as “Resident” if left blank
Only if you give one
06
Exploration and iteration
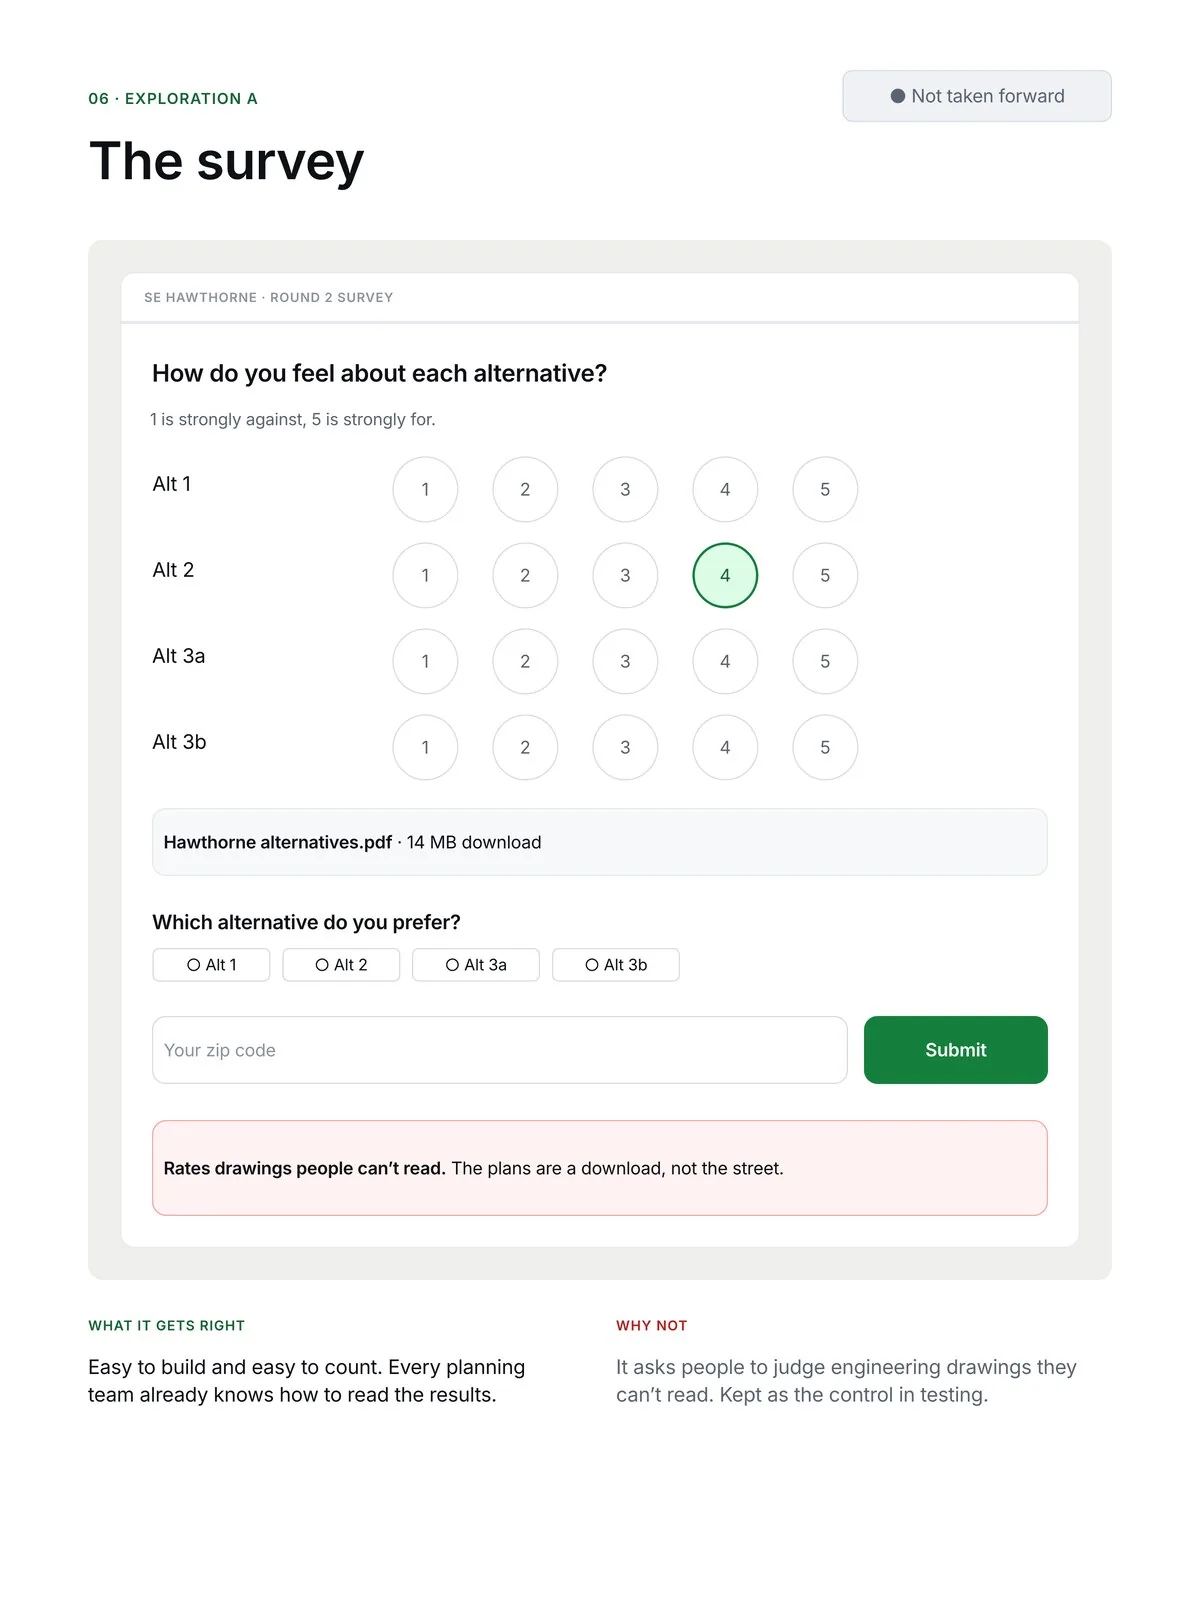
A. The survey. What cities use today, and the control in testing.
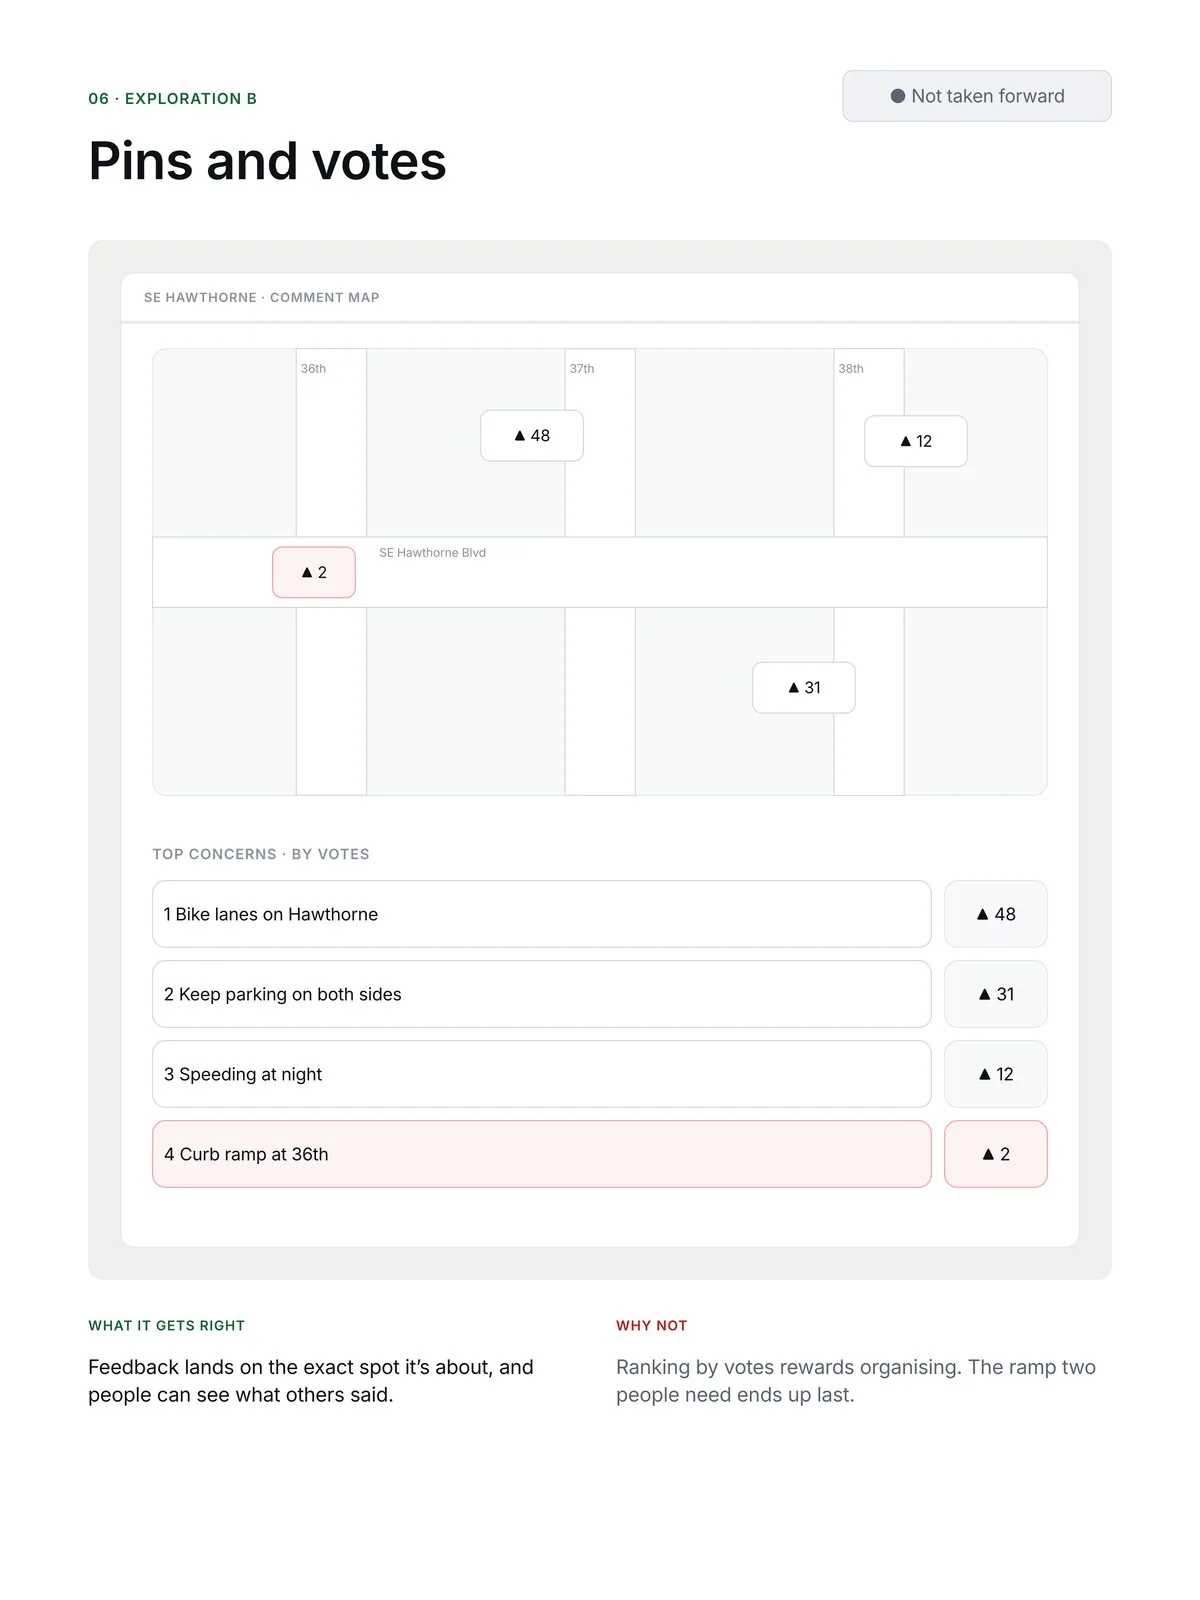
B. Pins and votes. Right place, but the ramp two people need ranks last.
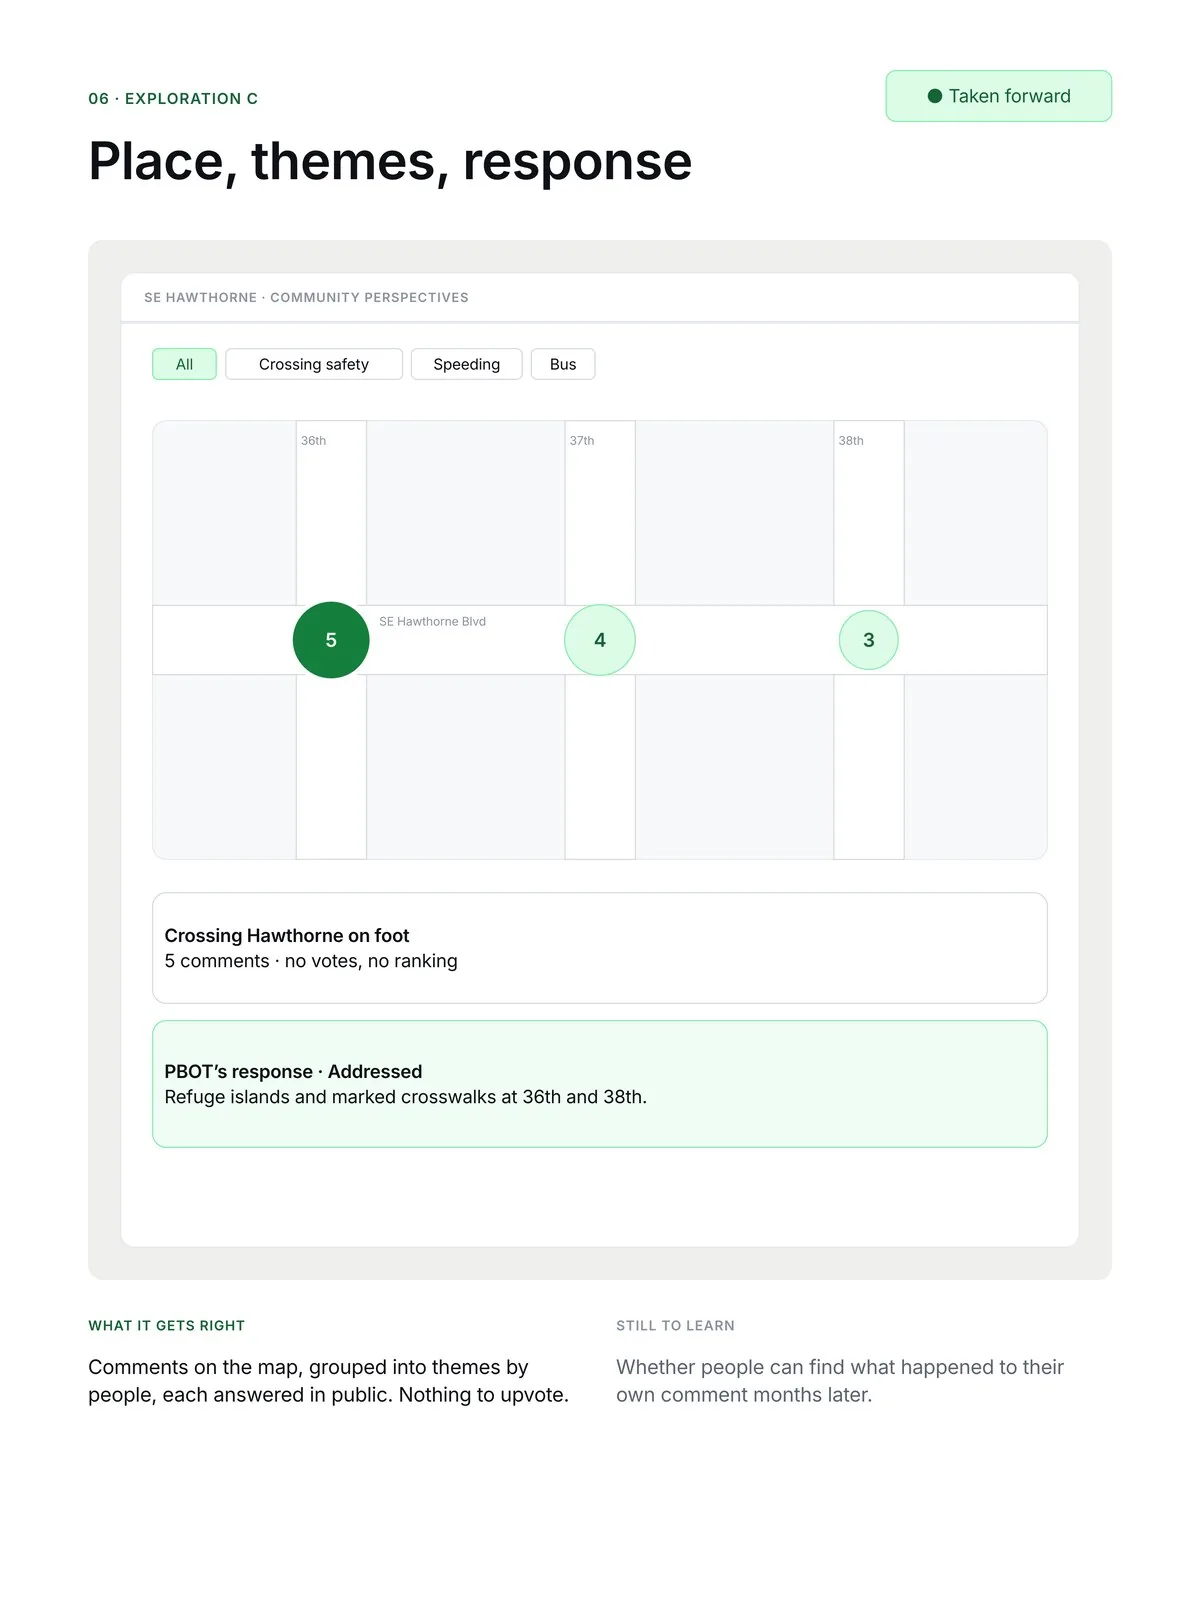
C. Place, themes, response. No votes. This one went forward.
Testing against the survey
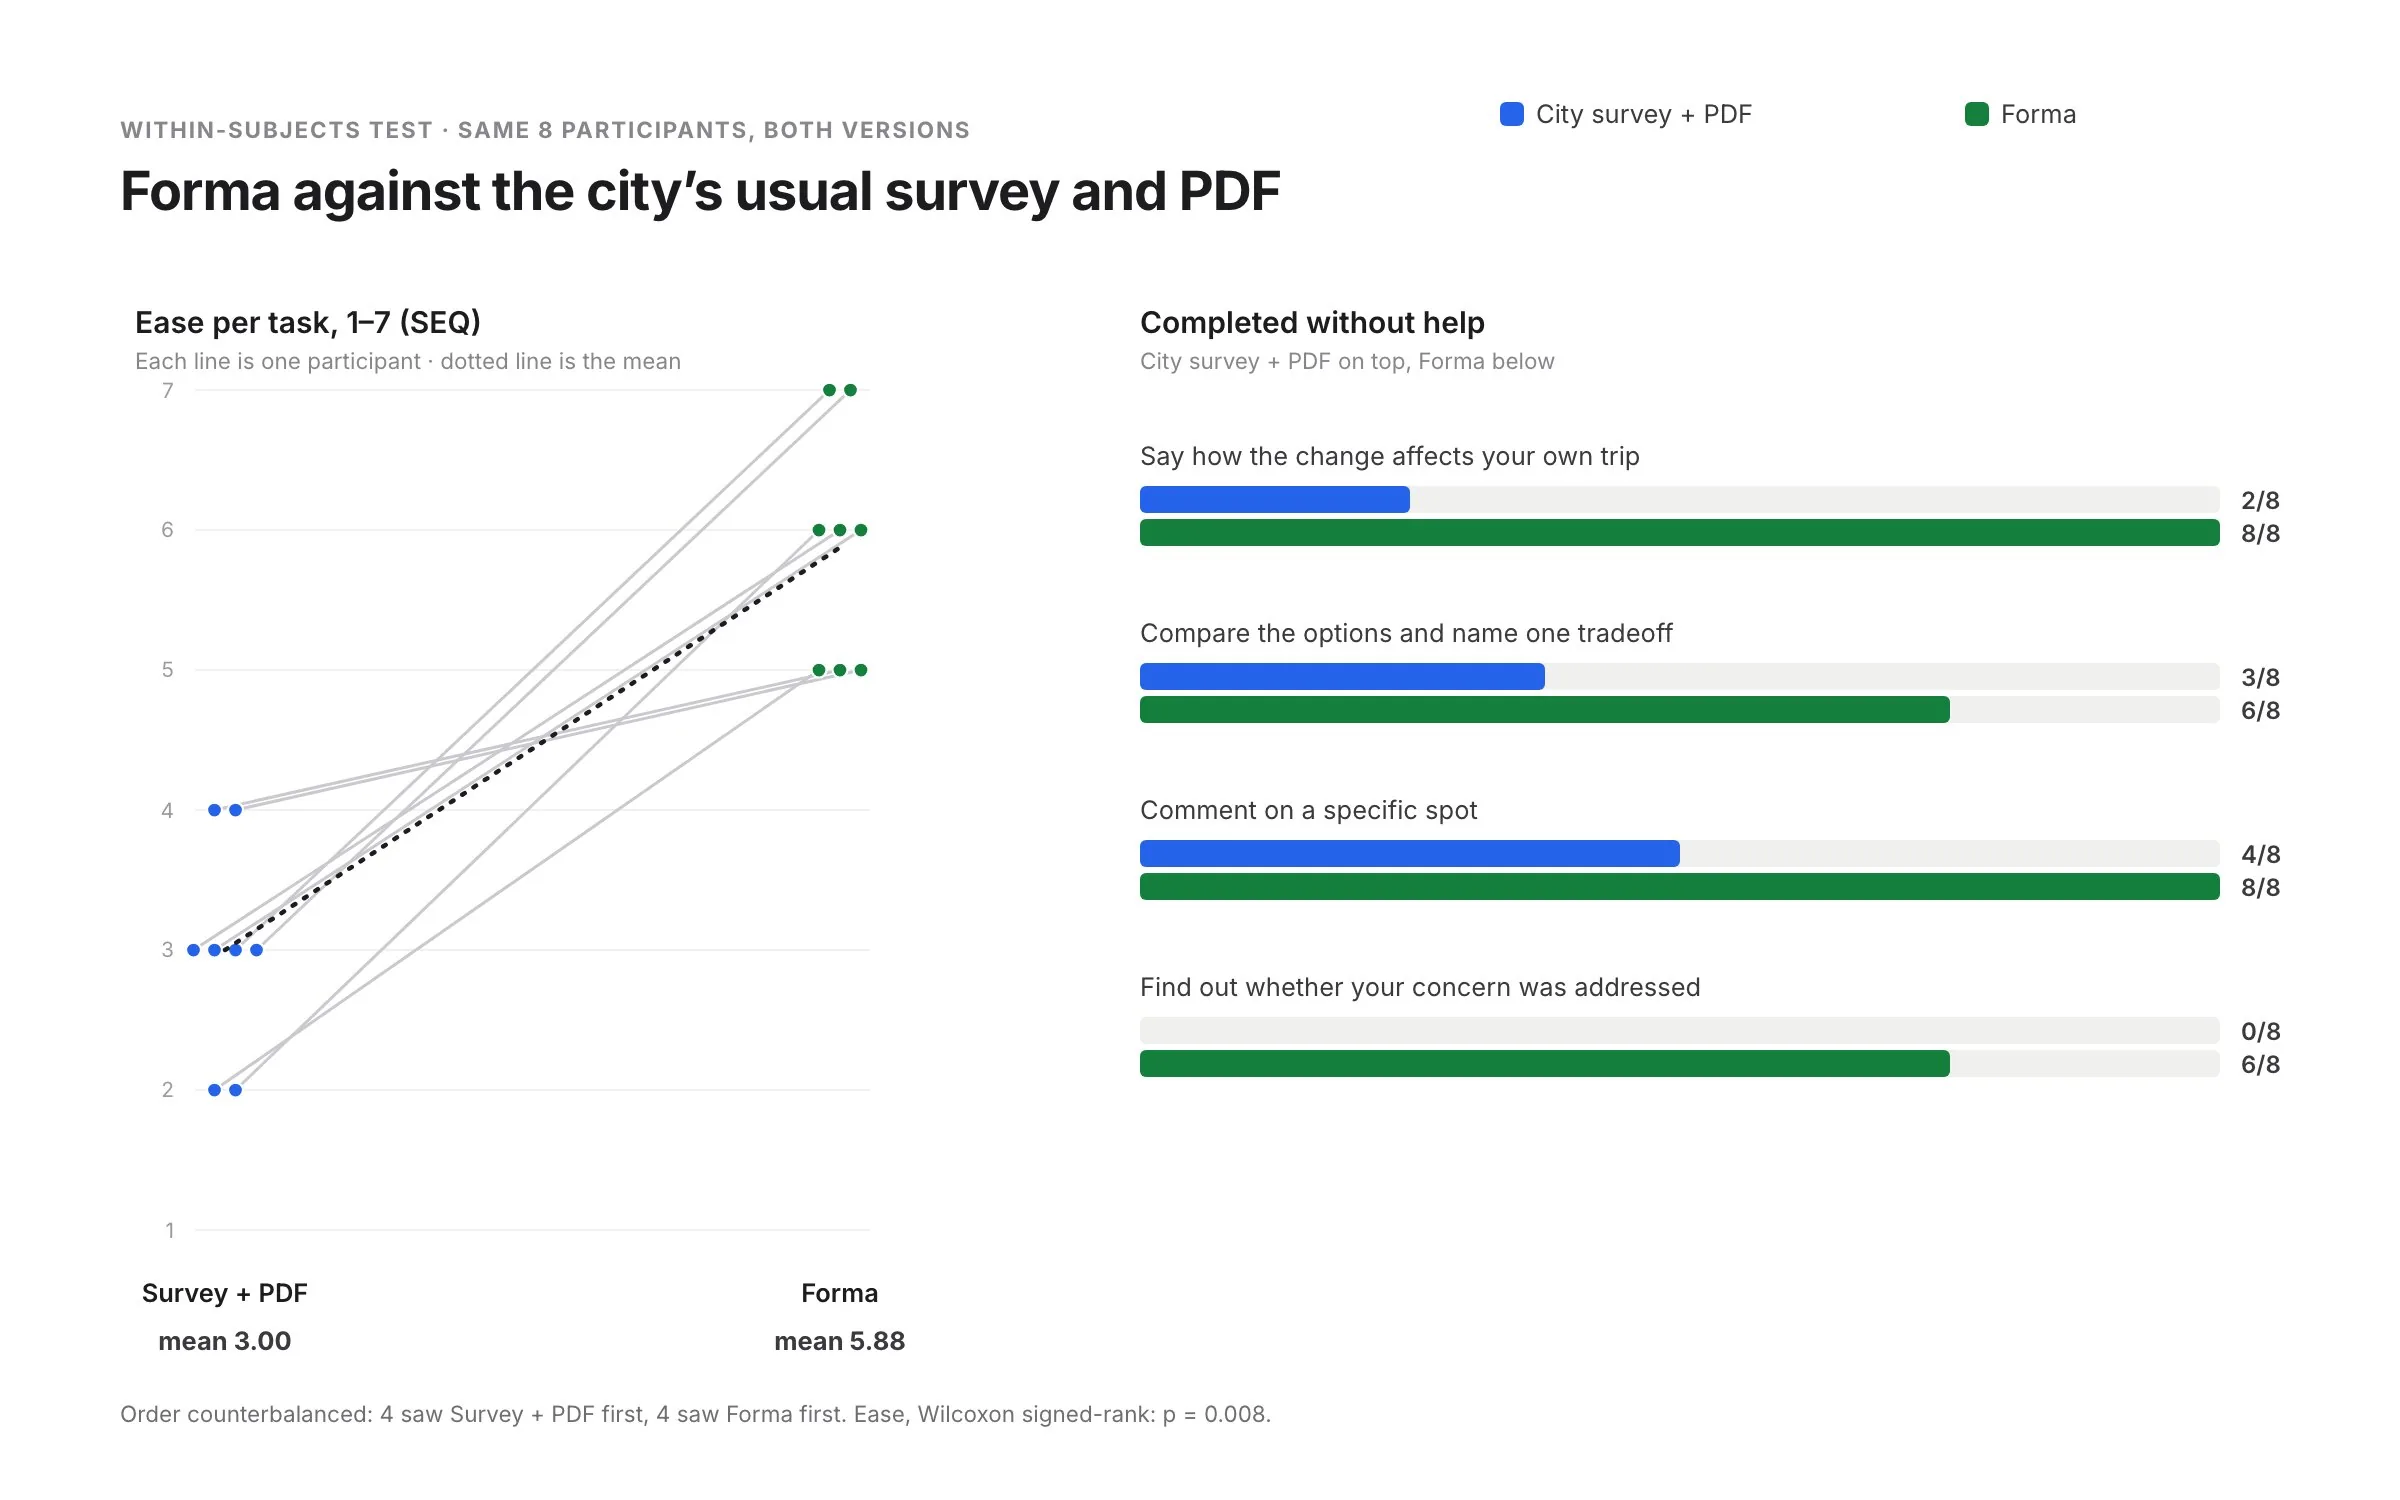
I tested Forma against what the city uses today: an online survey with the proposal as a PDF. Eight residents did the same four tasks in both, half starting with each to reduce order effects. I measured unaided completion, ease after each task (SEQ, 1 to 7), and one comprehension check: could they correctly describe how the change affects their own trip?
All 8 rated Forma easier: mean 3.0 vs 5.9 (Wilcoxon signed-rank, p = 0.008).
Task
Survey + PDF
Forma
What I saw
Say how the change affects your own trip
2 / 8
8 / 8
Most gave up in the PDF before the options table. In Forma the fastest answer took about 15 seconds.
Compare the options and name one tradeoff
3 / 8
6 / 8
Two couldn't tell 3a from 3b. Parking questions were still faster in the PDF.
Comment on a specific spot
4 / 8
8 / 8
The survey's text box has no place. One person pinned a block off, then moved it unaided.
Find out whether your concern was addressed
0 / 8
6 / 8
The two who failed found their theme but missed or misread its status.
Fix, then test again
“Not changed” read as “nothing changed at all”. → Each status now carries one sentence, and “Partly addressed” names which part. → In a second round of 5, all 5 read the status correctly.
The before/after handle went unnoticed at 200% zoom. → A labelled handle that starts in the middle, plus a “Compare in words” button. → 5 of 5 found it unprompted.
“Why are there two 3s?” → Each alternative card leads with the one thing that sets it apart. → 4 of 5 told 3a from 3b.
07
The final experience
Three features close the loop: see the change on your own corner, comment where it happens, and find out what came of it.
See it
The same street, today and as proposed
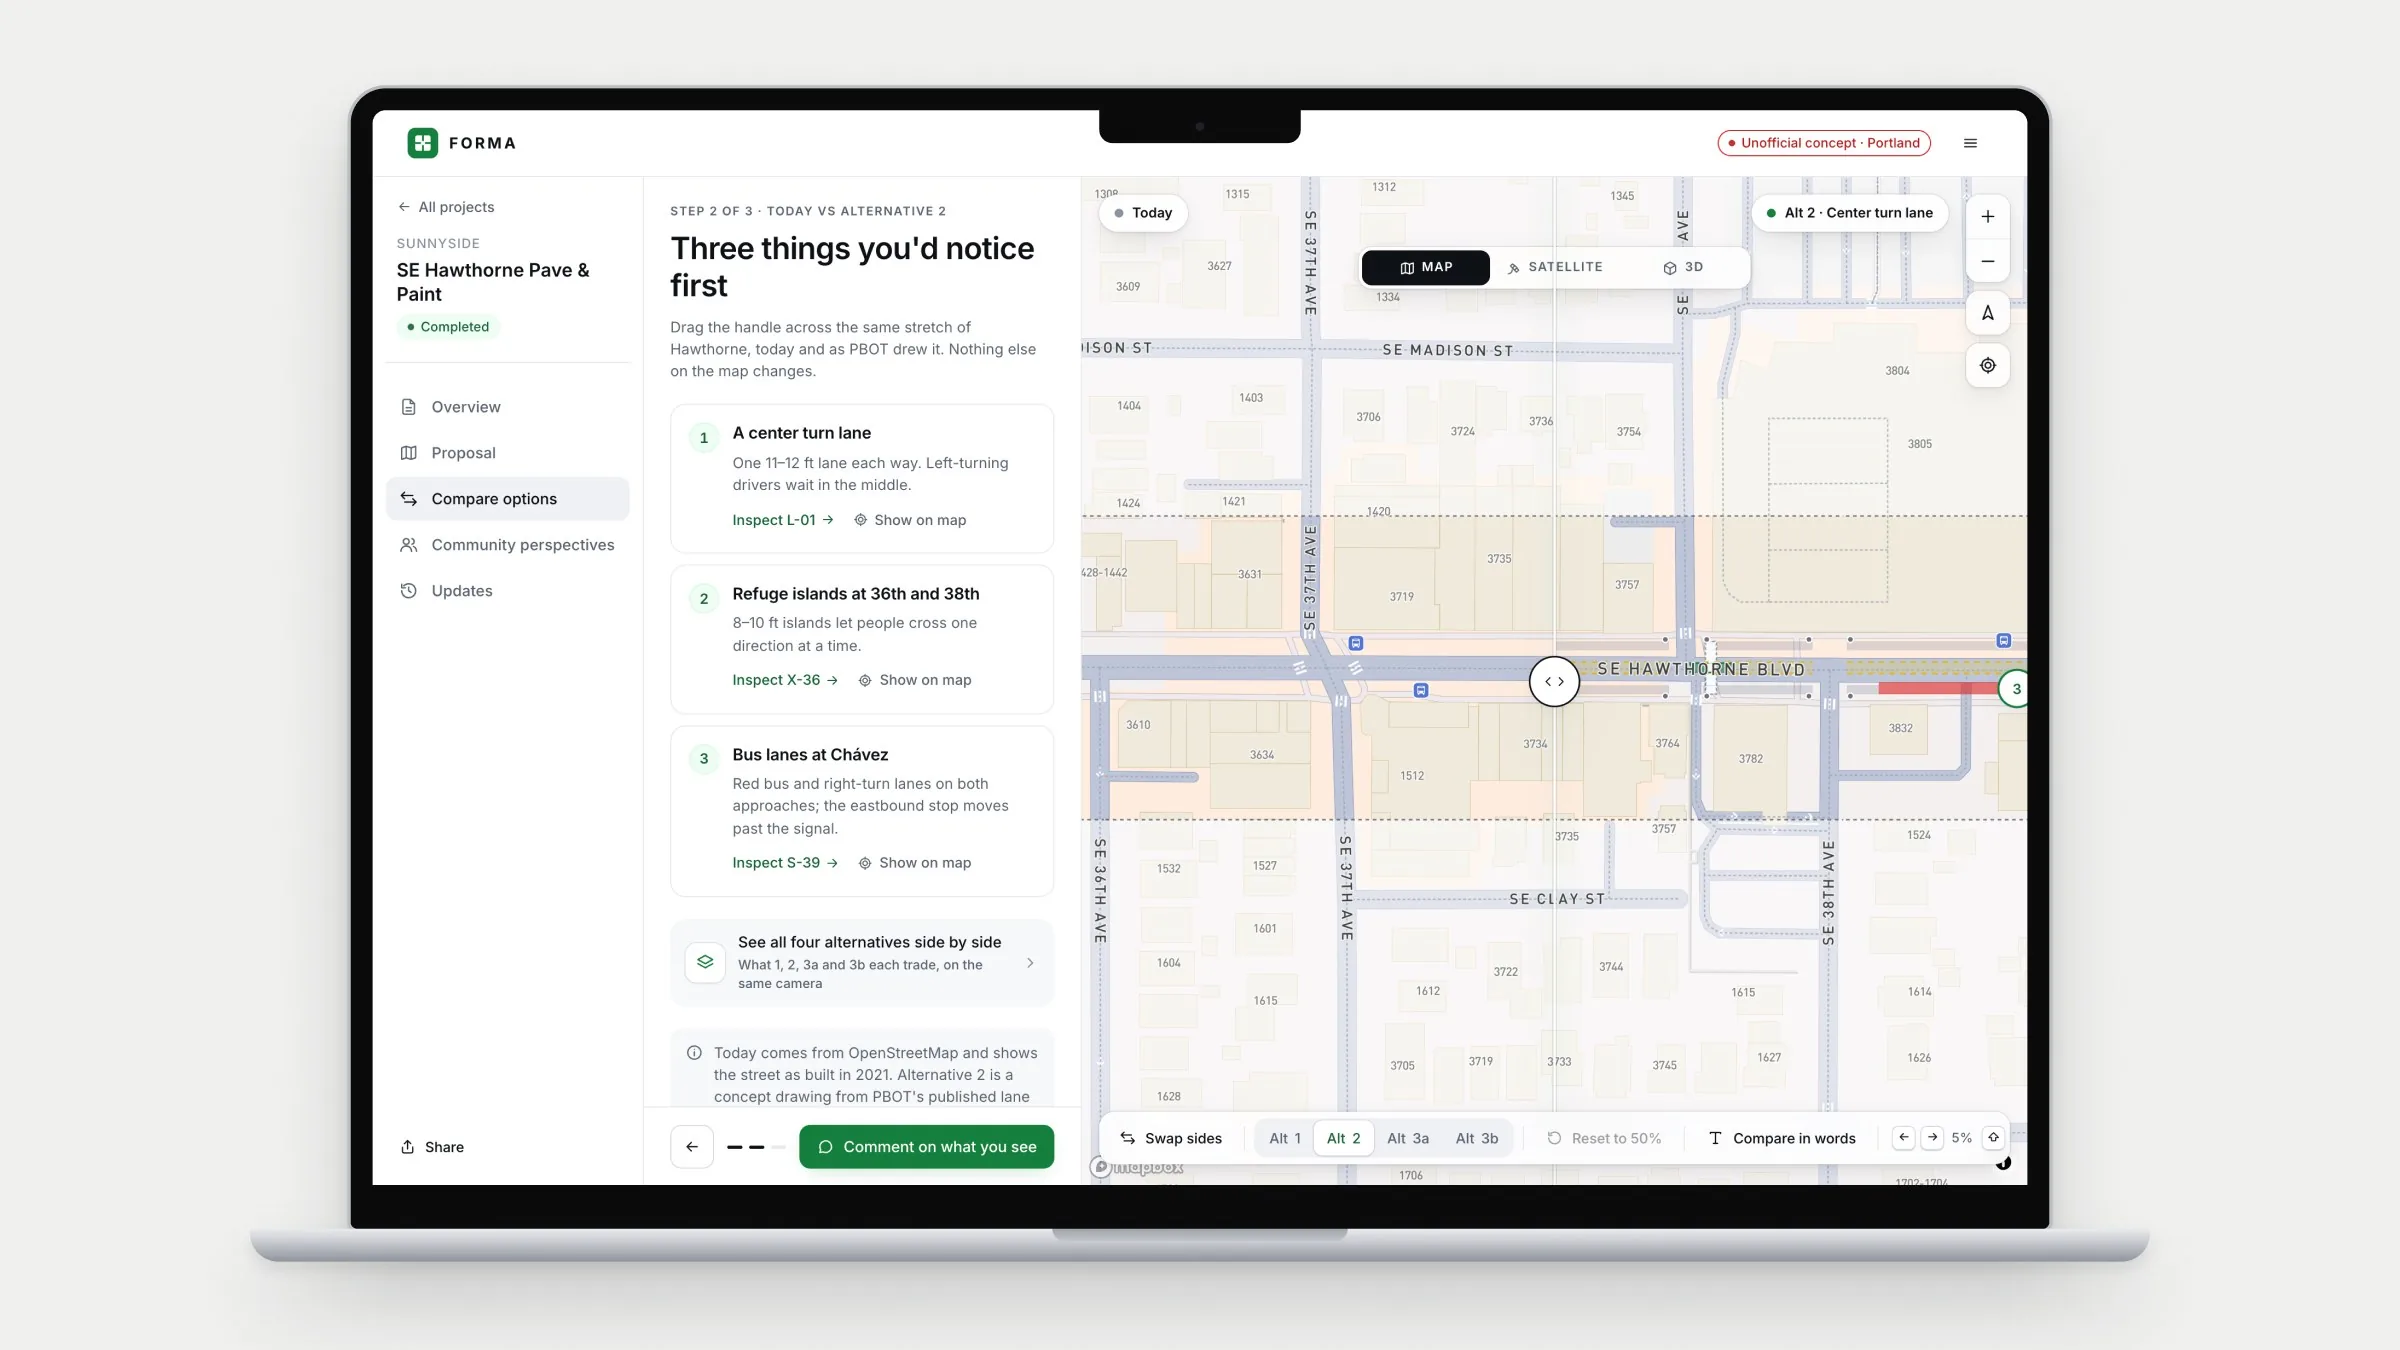
Drag one handle across Hawthorne and four lanes become three, refuge islands appear at 36th and 38th, and red bus lanes run into César E. Chávez Blvd. The side panel names the three changes you'd notice first.
What research showed
“Is the island the grey part? I can't tell what's road.” 3 of 7 misread PBOT's drawing, and 4 of 7 judged every option through one concern.
What I designed
Every alternative drawn on the same geometry, so only the change moves. Each change is labelled in words, and arrow keys or “Compare in words” replace dragging.
What testing showed
8 of 8 described how the change affects their own trip, against 2 of 8 with the survey and PDF.
Say it
Where it hurts, not how many agree
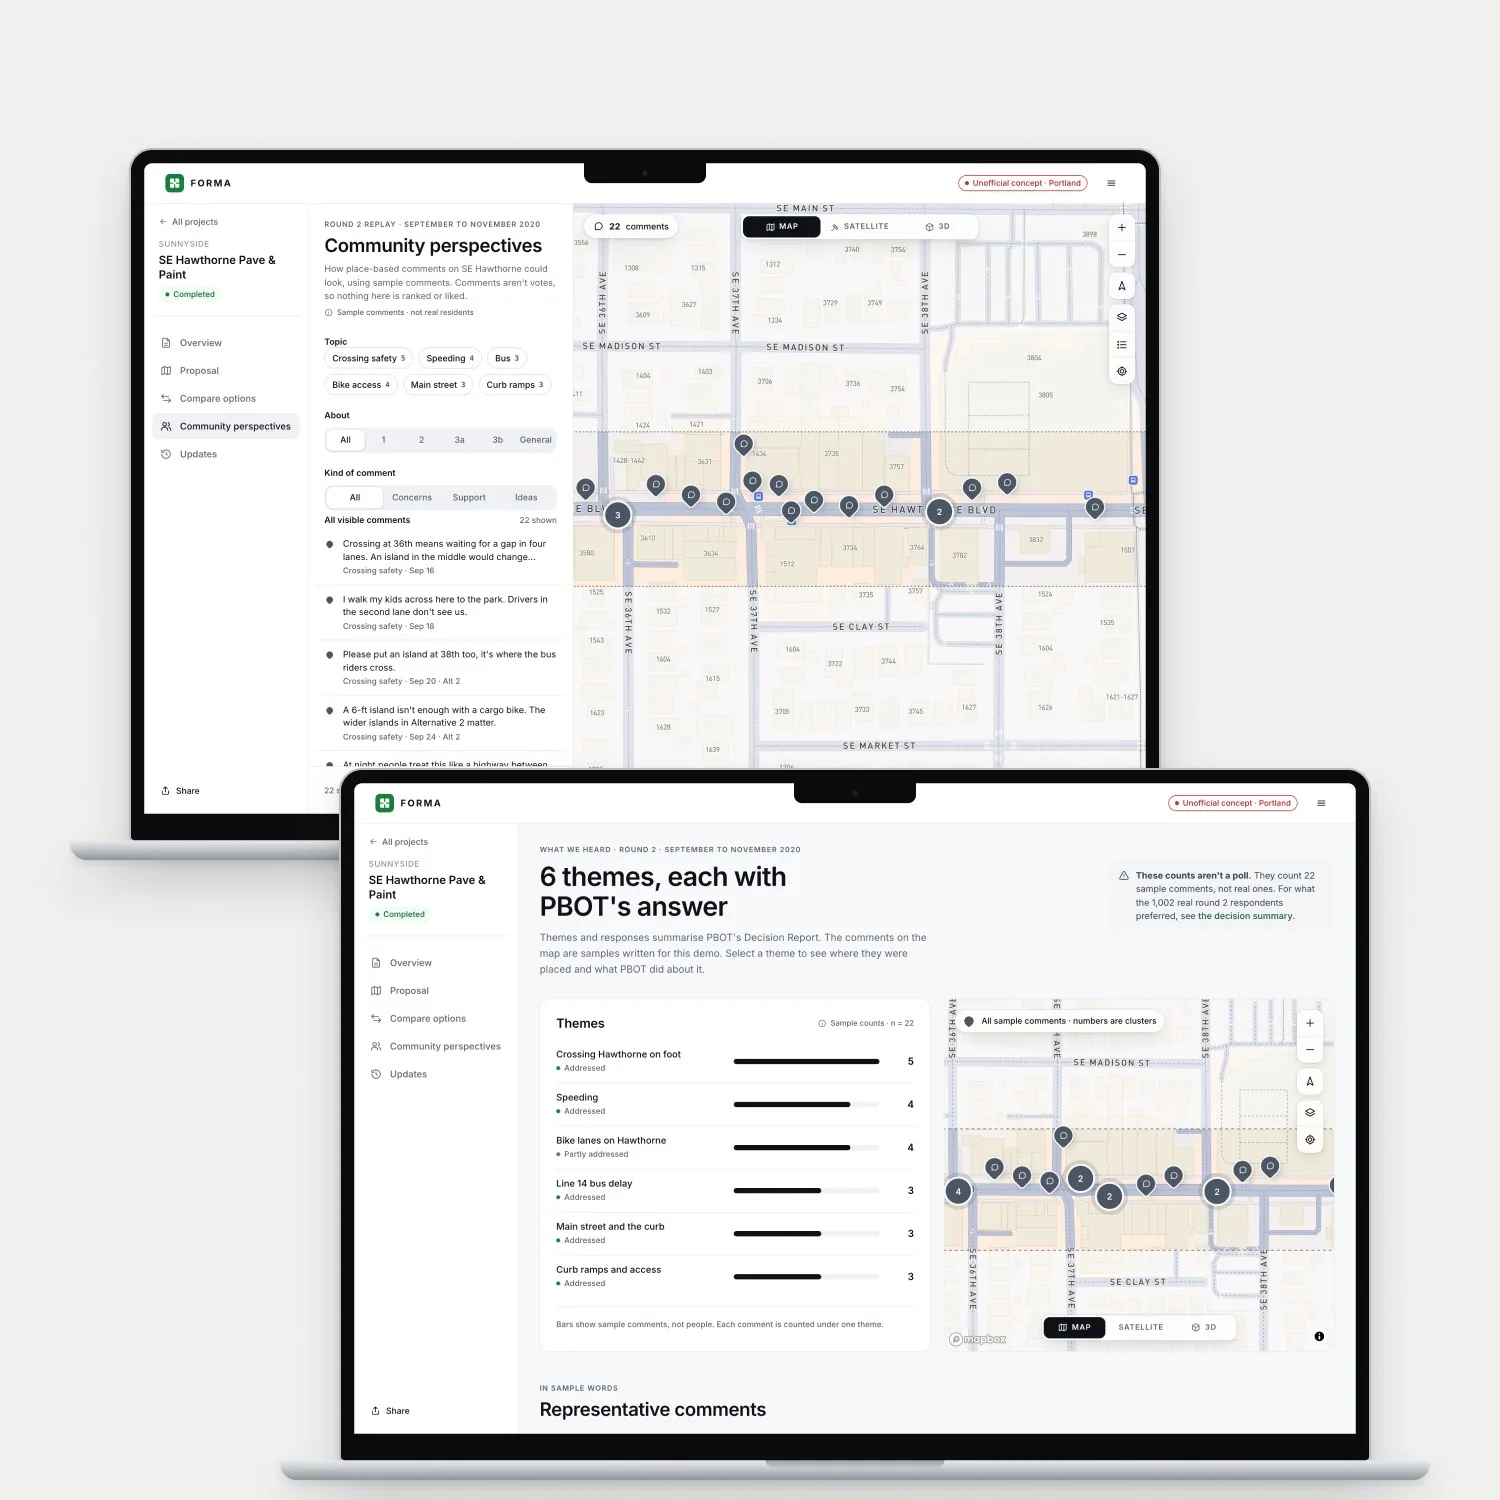
Residents pin a comment on the corner they mean, answering “What works, or worries you, here?” Comments cluster by block and topic, and the themes page opens with “These counts aren't a poll.”
What research showed
“People like me don't complain. We don't want trouble.” All 7 raised who sees a comment. With upvotes, the ramp two people needed ranked last.
What I designed
No account, “Resident” by default, and a preview of exactly what goes public. Nothing to like or upvote. Each theme carries the city's answer and a status.
What testing showed
8 of 8 commented on a specific spot, against 4 of 8 in the survey's text box.
See what came of it
What changed, and what didn't
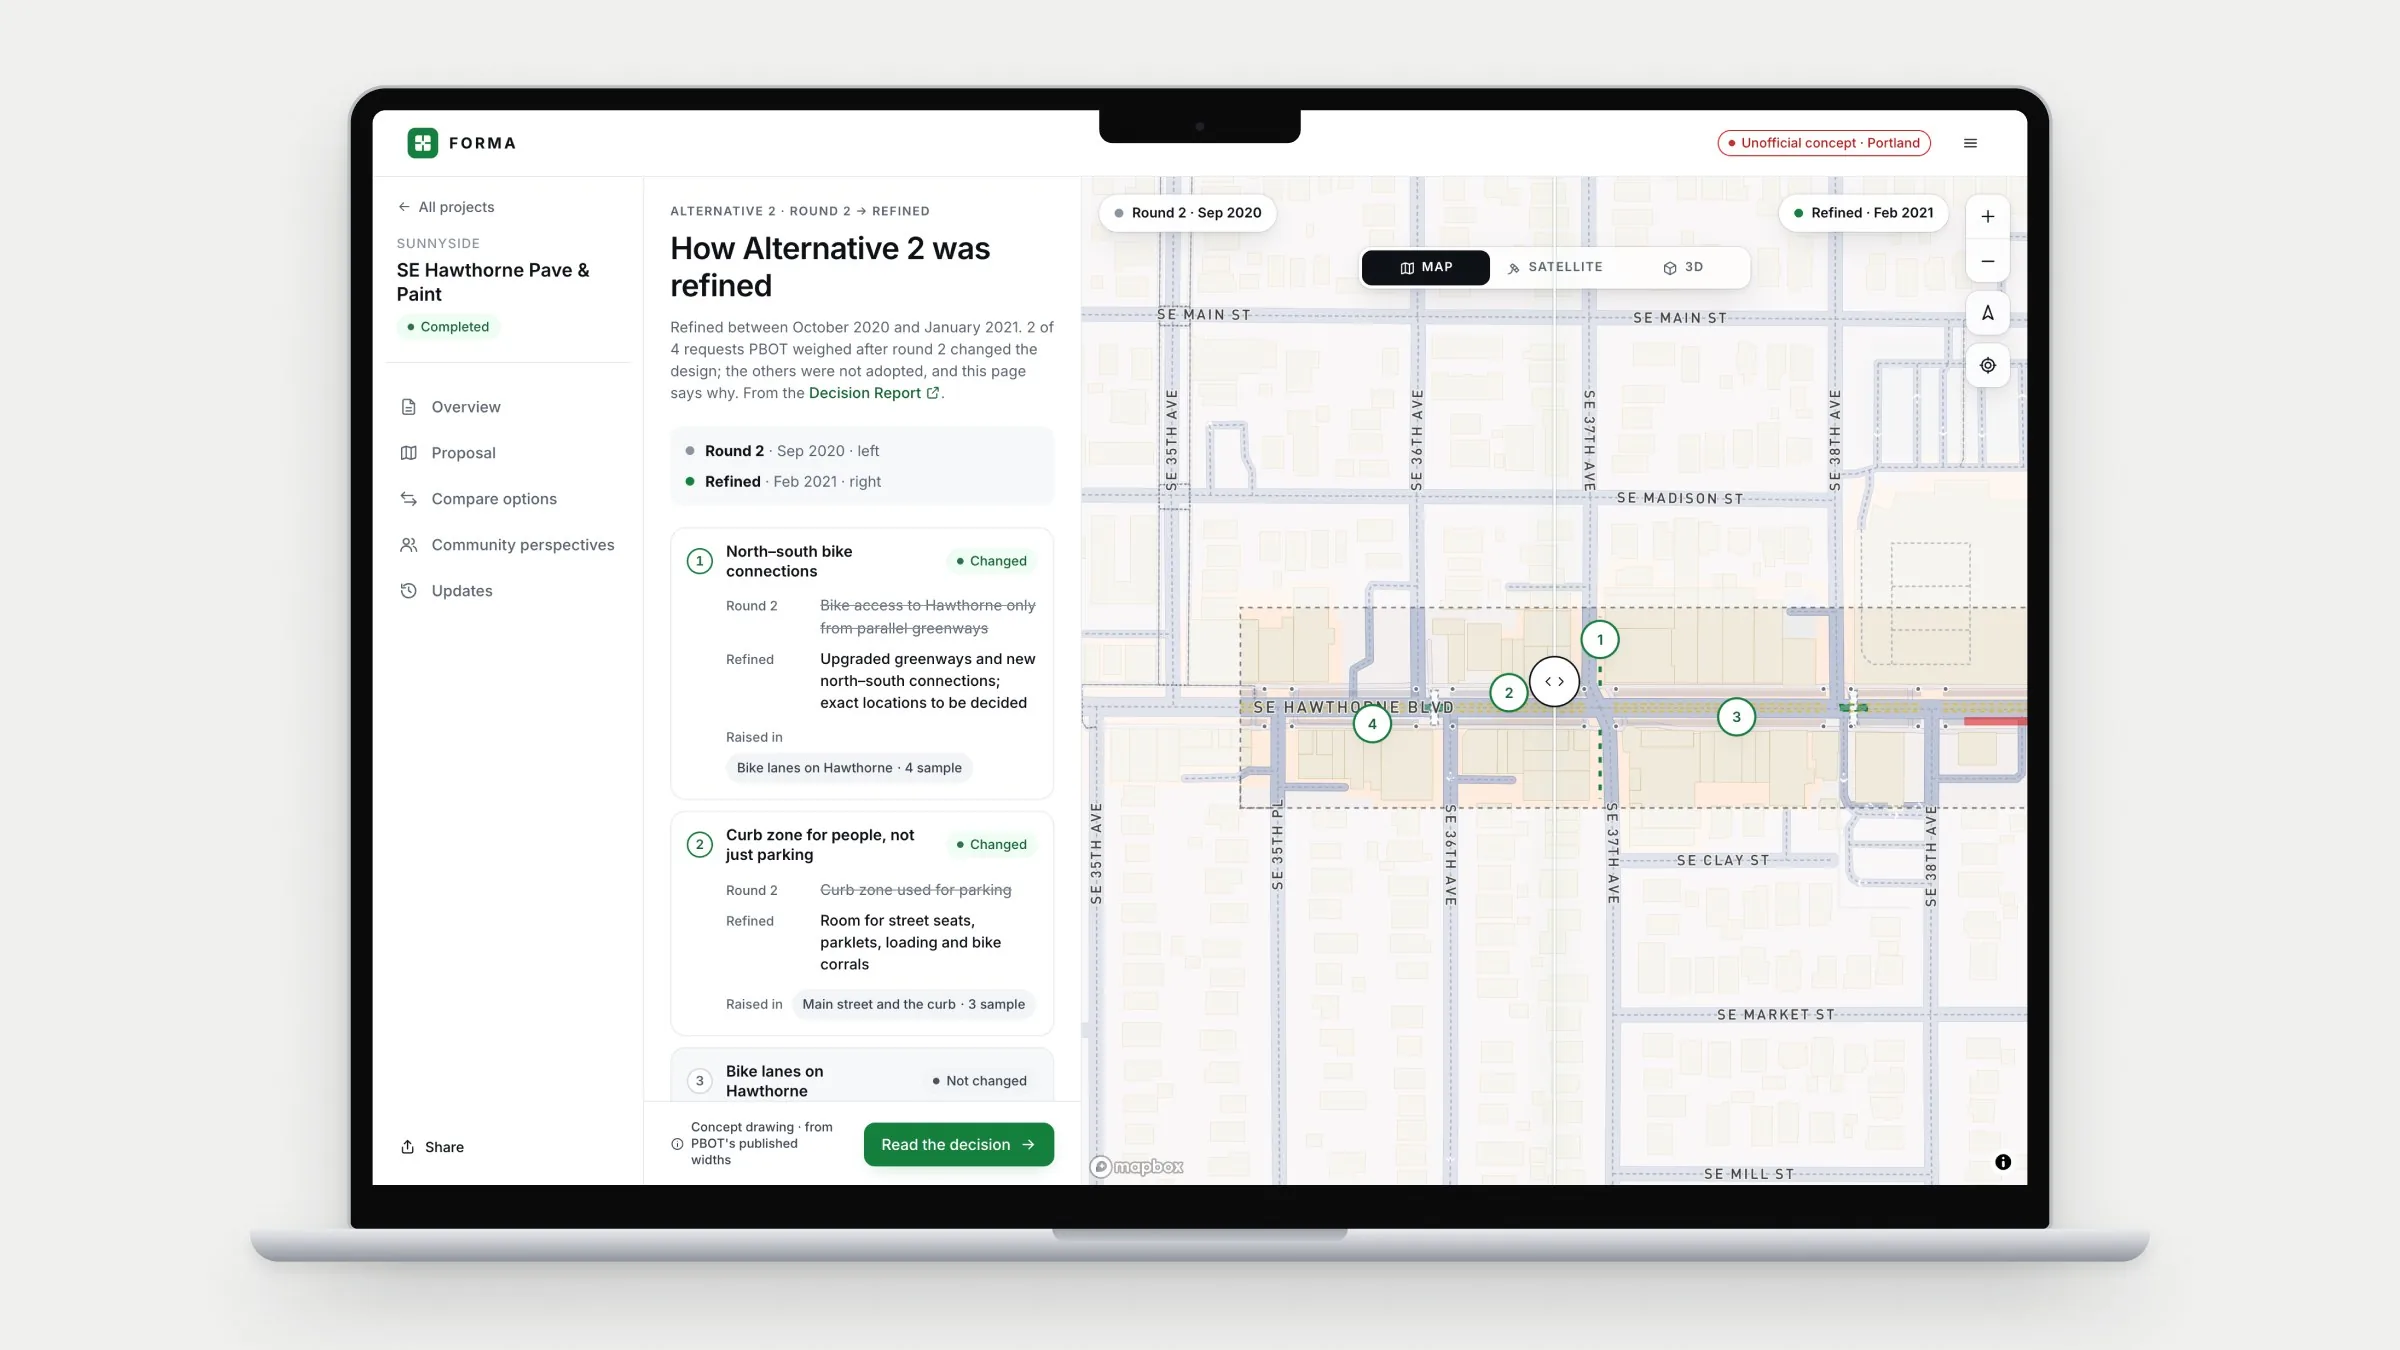
The revision sets Alternative 2 as rated in September 2020 beside the design PBOT chose in February 2021. Each change names the themes behind it, and “Not changed” cards explain why bike lanes on Hawthorne and wider sidewalks didn't happen.
What research showed
“I filled in a survey once and never heard back. I assumed it was already decided.” Closing the loop came up with all 7 participants.
What I designed
Every theme marked Addressed, Partly addressed, Still open or Not changed, each with a sentence of why. Behind it, a staff workspace where planners group comments, answer each theme and publish.
What testing showed
6 of 8 found out whether their concern was addressed. With the survey and PDF, nobody could.
Also in the product
Identical cards for all four alternatives, including keeping the street as it is, with a table that cites PBOT's report in every cell.
A receipt link that works without an account and says what the product can't promise: an individual reply.
“Everything on the map, in words”: the participant at 200% zoom answered the crossing question there in under a minute.
A decision summary that opens with the decision in one sentence, and a timeline to PBOT's 2026 and 2028 crash updates.
Staff triage that flags phone numbers and emails before anything goes public, and a publish check that every theme has an answer.
One green accent, Inter throughout, and map pins marked by symbol as well as colour.
08
Validation and outcomes
6 of 8
Found out whether their concern was addressed, against 0 of 8 with the survey and PDF.
8 of 8
Correctly described how the change affects their own trip, against 2 of 8.
3.0 → 5.9
Mean ease per task (SEQ, 1 to 7). All 8 rated Forma higher.
Still open
Numbers questions. When the question was parking spaces, the PDF table was faster. The comparison needs a plain numbers view.
Who wrote the answer. “A person at the city, or a computer?” Each response now names its team, but trust in that answer is untested.
Comments in other languages. One participant wrote in their first language and asked if it would still count. The product needs to say yes, and staff need a way to read it.
For a live project, the measure I'd track is comments that reach an answer: the share whose theme has a published response their author can find. Submission volume is the wrong target.
09
Reflection and next steps
What participants taught me
People want to be read, not to win. “I don't need to win. I need to know someone read it.” That made the not-changed cards as important as the changes.
A status is a verdict. Labels I treated as neutral read as polite refusals until each one carried a reason.
The resident experience depends on the staff tool. The planner's empty “response” column showed that closing the loop is a workflow problem first.
The text version is a main way in. For the participant at 200% zoom it was the faster route, not a fallback.
What's next
Time the staff workflow. Test theme replies with more planners, inside a real legal and comms review.
Updates that come to people. “I'd never come back to a link. Text me.” Opt-in text updates come next.
Mobile as the main way in. A resident standing at the corner with a phone is probably the best moment to ask.
The years after. PBOT's crash updates in 2026 and 2028 should bring people back to see what happened at the crossings.
Sources
6
National Highway Traffic Safety Administration. “Pedestrians: 2022 Data.” Traffic Safety Facts, DOT HS 813 590, 2024. Link
Arnstein, S. R. “A Ladder of Citizen Participation.” Journal of the American Institute of Planners, 35(4), 1969.
Einstein, K. L., Palmer, M. & Glick, D. M. “Who Participates in Local Government? Evidence from Meeting Minutes.” Perspectives on Politics, 2019. Link
International Association for Public Participation. IAP2 Spectrum of Public Participation.
Portland Bureau of Transportation. “SE Hawthorne Pave and Paint: Decision Report.” February 2021. Link
Portland Bureau of Transportation. “SE Hawthorne Boulevard Projects Evaluation Report.” October 2023, updated June 2025. Link